
Word Prominence: A Primer
Posted 6/9/2025
A common task in natural language processing is determining what a text (a book, speech, tweet, email) is about. At its simplest, we may start by asking what words appear most prominently in a text, in the hope that they’ll be topic key-words. Here “prominence” is when a word appears disproportionately in this text compared to others. For example, “the,” “a,” and “and” will always appear with high frequency, but they appear with high frequency in every text and are uninteresting to us.
Our approach will start by reducing a text to a list of words and a count of how many times they occur, typically referred to as a bag of words model. This destroys sentence structure and context, a little like burning an essay and sifting through the ashes, but hey, it keeps the math simple, and you have to start somewhere.
For all of the techniques outlined below we’ll need two texts: the text we’re interested in studying, and a “baseline” corpus of text for comparison.
TF-IDF
Our first contender for identifying keywords is term-frequency inverse-document-frequency or TF-IDF. For each word in our text of interest we’ll first measure the frequency with which it occurs, or literally the number of times the word appears divided by the total number of words in the text. For example in Python, if t is a particular term and d is a dictionary of words and how many times they appear, then:
def tf(t, d):
    total = sum(d.values())
    return d[t] / total
Then we’ll examine a number of other texts for comparison, and count how many of those texts contain the target word. Formally the inverse document frequency is defined as:
Or in Python, if D is a list of documents (where each document is a dictionary of terms and how many times they appear, as in tf):
def idf(t, D):
    total = 0
    for d in D:
        if( t in d.keys() ):
            total += 1
    return math.log(len(D) / total)
This means if a term appears in all N documents we’ll get idf(t, D) = log(N/N) = 0, and the fewer documents a term appears in, the higher its IDF score will be.
We can combine term-frequency and inverse-document frequency as simply term-frequency times inverse document frequency, or:
Now terms that appear in many documents will get a low score, and terms that appear in the target document with low frequency will get a low score, but terms that appear with relatively high frequency in the text of interest and appear in few other documents will get a high score.
What does this get us in practice? Well, to borrow Wikipedia’s example, we can compare every play by Shakespeare (I grabbed the Comedy, History, and Tragedy selection from here). Here are the top terms in Romeo and Juliet, sorted by their TF-IDF scores:
| Word | TF | IDF | TF-IDF |
|---|---|---|---|
| romeo | 0.0097 | 3.6109 | 0.0350 |
| juliet | 0.0057 | 2.9178 | 0.0166 |
| capulet | 0.0045 | 3.6109 | 0.0164 |
| mercutio | 0.0028 | 3.6109 | 0.0100 |
| benvolio | 0.0025 | 3.6109 | 0.0091 |
| tybalt | 0.0024 | 3.6109 | 0.0086 |
| laurence | 0.0024 | 2.9178 | 0.0070 |
| friar | 0.0031 | 1.5315 | 0.0047 |
| montague | 0.0013 | 2.9178 | 0.0039 |
| paris | 0.0018 | 1.4137 | 0.0026 |
| nurse | 0.0046 | 0.5664 | 0.0026 |
| sampson | 0.0007 | 2.9178 | 0.0019 |
| balthasar | 0.0006 | 2.5123 | 0.0014 |
| gregory | 0.0006 | 2.0015 | 0.0012 |
| peter | 0.0009 | 1.3083 | 0.0012 |
| mantua | 0.0004 | 2.5123 | 0.0011 |
| thursday | 0.0004 | 2.5123 | 0.0011 |
The top terms in the play by term frequency are “and,” “the,” and “I,” which each appear about 2% of the time - but these terms all have IDF scores of zero because they appear in every play, and so receive a TF-IDF score of zero as well.
However, only one play includes “Romeo.” This makes up almost 1% of Romeo and Juliet - very common, the twelfth most common or so word - but top of the list by TF-IDF standards.
TF-IDF isn’t perfect - it’s identified many of the names of characters, but also words like “Thursday” and “Paris” (not the setting, which is Verona, Italy) that aren’t especially central to the plot. Nevertheless, TF-IDF is impressively effective given its simplicity. So where does it really fall flat?
The biggest shortcoming of IDF is that it’s boolean: a term either appears in a document or not. However, in large corpora of text we often require more nuance than this. Consider trying to identify what topics a subreddit discusses by comparing comments in the subreddit to comments in other subreddits. In 2020 people in practically every subreddit were discussing COVID-19 - it impacted music festivals, the availability of car parts, the cancellation of sports games, and had some repercussion in almost every aspect of life. In this setting Covid would have an IDF score of near zero, but we may still want to identify subreddits that talk about Covid disproportionately to other communities.
Jensen-Shannon Divergence
Jensen-Shannon Divergence, or JSD, compares term frequencies across text corpora directly rather than with an intermediate “does this word appear in a document or not” step. At first this appears trivial: just try tf(t, d1) - tf(t, d2) or maybe tf(t, d1) / tf(t, d2) to measure how much a term’s frequency has changed between documents 1 and 2.
The difference between term frequencies is called a proportion shift, and is sometimes used. Unfortunately, it has a tendency to highlight uninteresting words. For example, if “the” occurs 2% of the time in one text and 1.5% of the time in another text, that’s a shift of 0.5%, more than Capulet’s 0.45%.
The second approach, a ratio of term frequencies, is more appealing. A relative change in frequencies may help bury uninteresting “stop words” like “the,” “a,” and “it,” and emphasize more significant shifts. However, there’s one immediate limitation: if a term isn’t defined in d2 then we’ll get a division-by-zero error. Some frequency comparisons simply skip over words that aren’t defined in both corpora, but these may be the exact topic words that we’re interested in. Other frequency comparisons fudge the numbers a little, adding 1 to the number of occurrences of every word to ensure every term is defined in both texts, but this leads to less mathematical precision, especially when the texts are small.
Jensen-Shannon Divergence instead compares the frequency of words in one text corpus against the frequency of words in a mixture corpus M:
Here, M is defined as the average frequency with which a term appears in the two texts, or M=1/2 * (P+Q). This guarantees that every term from texts P and Q will appear in M. Additionally, D refers to the Kullback-Leibler Divergence, which is defined as:
The ratio of frequencies gives us a measure of how much the term prominence has shifted, and multiplying by P(x) normalizes our results. In other words, if the word “splendiforous” appears once in one book and not at all in another then that might be a large frequency shift, but P(x) is vanishingly small and so we likely don’t care.
Note that JSD is defined in terms of the total amount that two texts diverge from one another. In this case we’re interested in identifying the most divergent terms between two texts rather than the total divergence, so we can simply rank terms by P(x) * log(P(x)/M(x)). Returning to our Romeo and Juliet example, such a ranking comparing the play to Othello (made by the Shifterator package) might look like:
Jensen-Shannon Divergence can find prominent terms that TF-IDF misses, and doesn’t have any awkward corners with terms that only appear in one text. However, it does have some limitations:
-
First, JSD is sensitive to text size imbalance: the longer a text is, the smaller a percentage each word in the text is likely to appear with, so measuring change in word prominence between a small and large text will indicate that all the words in the short text have higher prominence. To some extent this problem is fundamental - you can’t meaningfully compare word prominence between a haiku and a thousand-page book - but some metrics are more sensitive to size imbalances than others.
-
Second, KLD has a built-in assumption: frequency shifts for common words are more important than frequency shifts for uncommon words. For example, if a word leaps in frequency from 0.00005 to 0.00010 then its prominence has doubled, but it remains an obscure word in both texts. Multiplying the ratio of frequencies by
P(x)ensures that only words that appear an appreciable amount will have high divergence. What’s missing is a tuning parameter: how much should we prefer shifts in common terms to shifts in uncommon terms? Should there be a linear relationship between frequency and how much we value a frequency shift, or should it be an exponential relationship?
These two shortcomings led to the development of the last metric I’ll discuss today.
Rank-Turbulence Divergence
Rank-Turbulence Divergence is a comparatively new metric by friends at the Vermont Complex Systems Institute. Rather than comparing term frequency it compares term rank. That is, if a term moves from the first most prominent (rank 1) to the fourth (rank 4) that’s a rank shift of three. In text, term frequency tends to follow a Zipf distribution such that the rank 2 term appears half as often as the rank 1 term, and the rank 3 term a third as much as rank 1, and so on. Therefore, we can measure the rank as a proxy for examining term frequency. This is convenient, because rank does not suffer from the “frequency of individual terms decreases the longer the text is” challenge that JSD faces.
Critically, we do need to discount changes in high rank (low frequency) terms. If a term moves from 2nd most prominent to 12th most prominent, that’s a big change. If a term moves from 1508th most prominent to 1591st, that’s a little less interesting. However, instead of multiplying by the term frequency as in KLD, Rank Turbulence Divergence offers an explicit tuning parameter for setting how much more important changes in low rank terms are than high rank.
For words that appear in one text but not another, rank turbulence divergence assigns them the highest rank in the text. For example, if text 1 contains 200 words, but not “blueberry,” then blueberry will have rank 201, as will every other word not contained in the text. This is principled, because we aren’t assigning a numeric value to how often the term appears, only truthfully reporting that words like “blueberry” appear less than every other term in the text.
The math at first looks a little intimidating:
Even worse, that “normalization factor” is quite involved on its own:
However, the heart of the metric is in the absolute value summation:
If all we want to do is identify the most divergent terms in each text, and not measure the overall divergence of the two systems, then this snippet is enough. It also builds our intuition for the metric: all we’re really doing is measuring a change in inverse rank, with a knob to tune how much we emphasize changes for common words. The knob ranges from 0 (high and low ranked terms are equally “important”) to infinity (massively emphasize shifts in common words, ignoring shifts in rare words). Here’s an example plotting the difference in words used on two subreddits, r/NoNewNormal (which was a covid conspiracy group) and r/CovIdiots (which called out people acting foolishly during the pandemic):
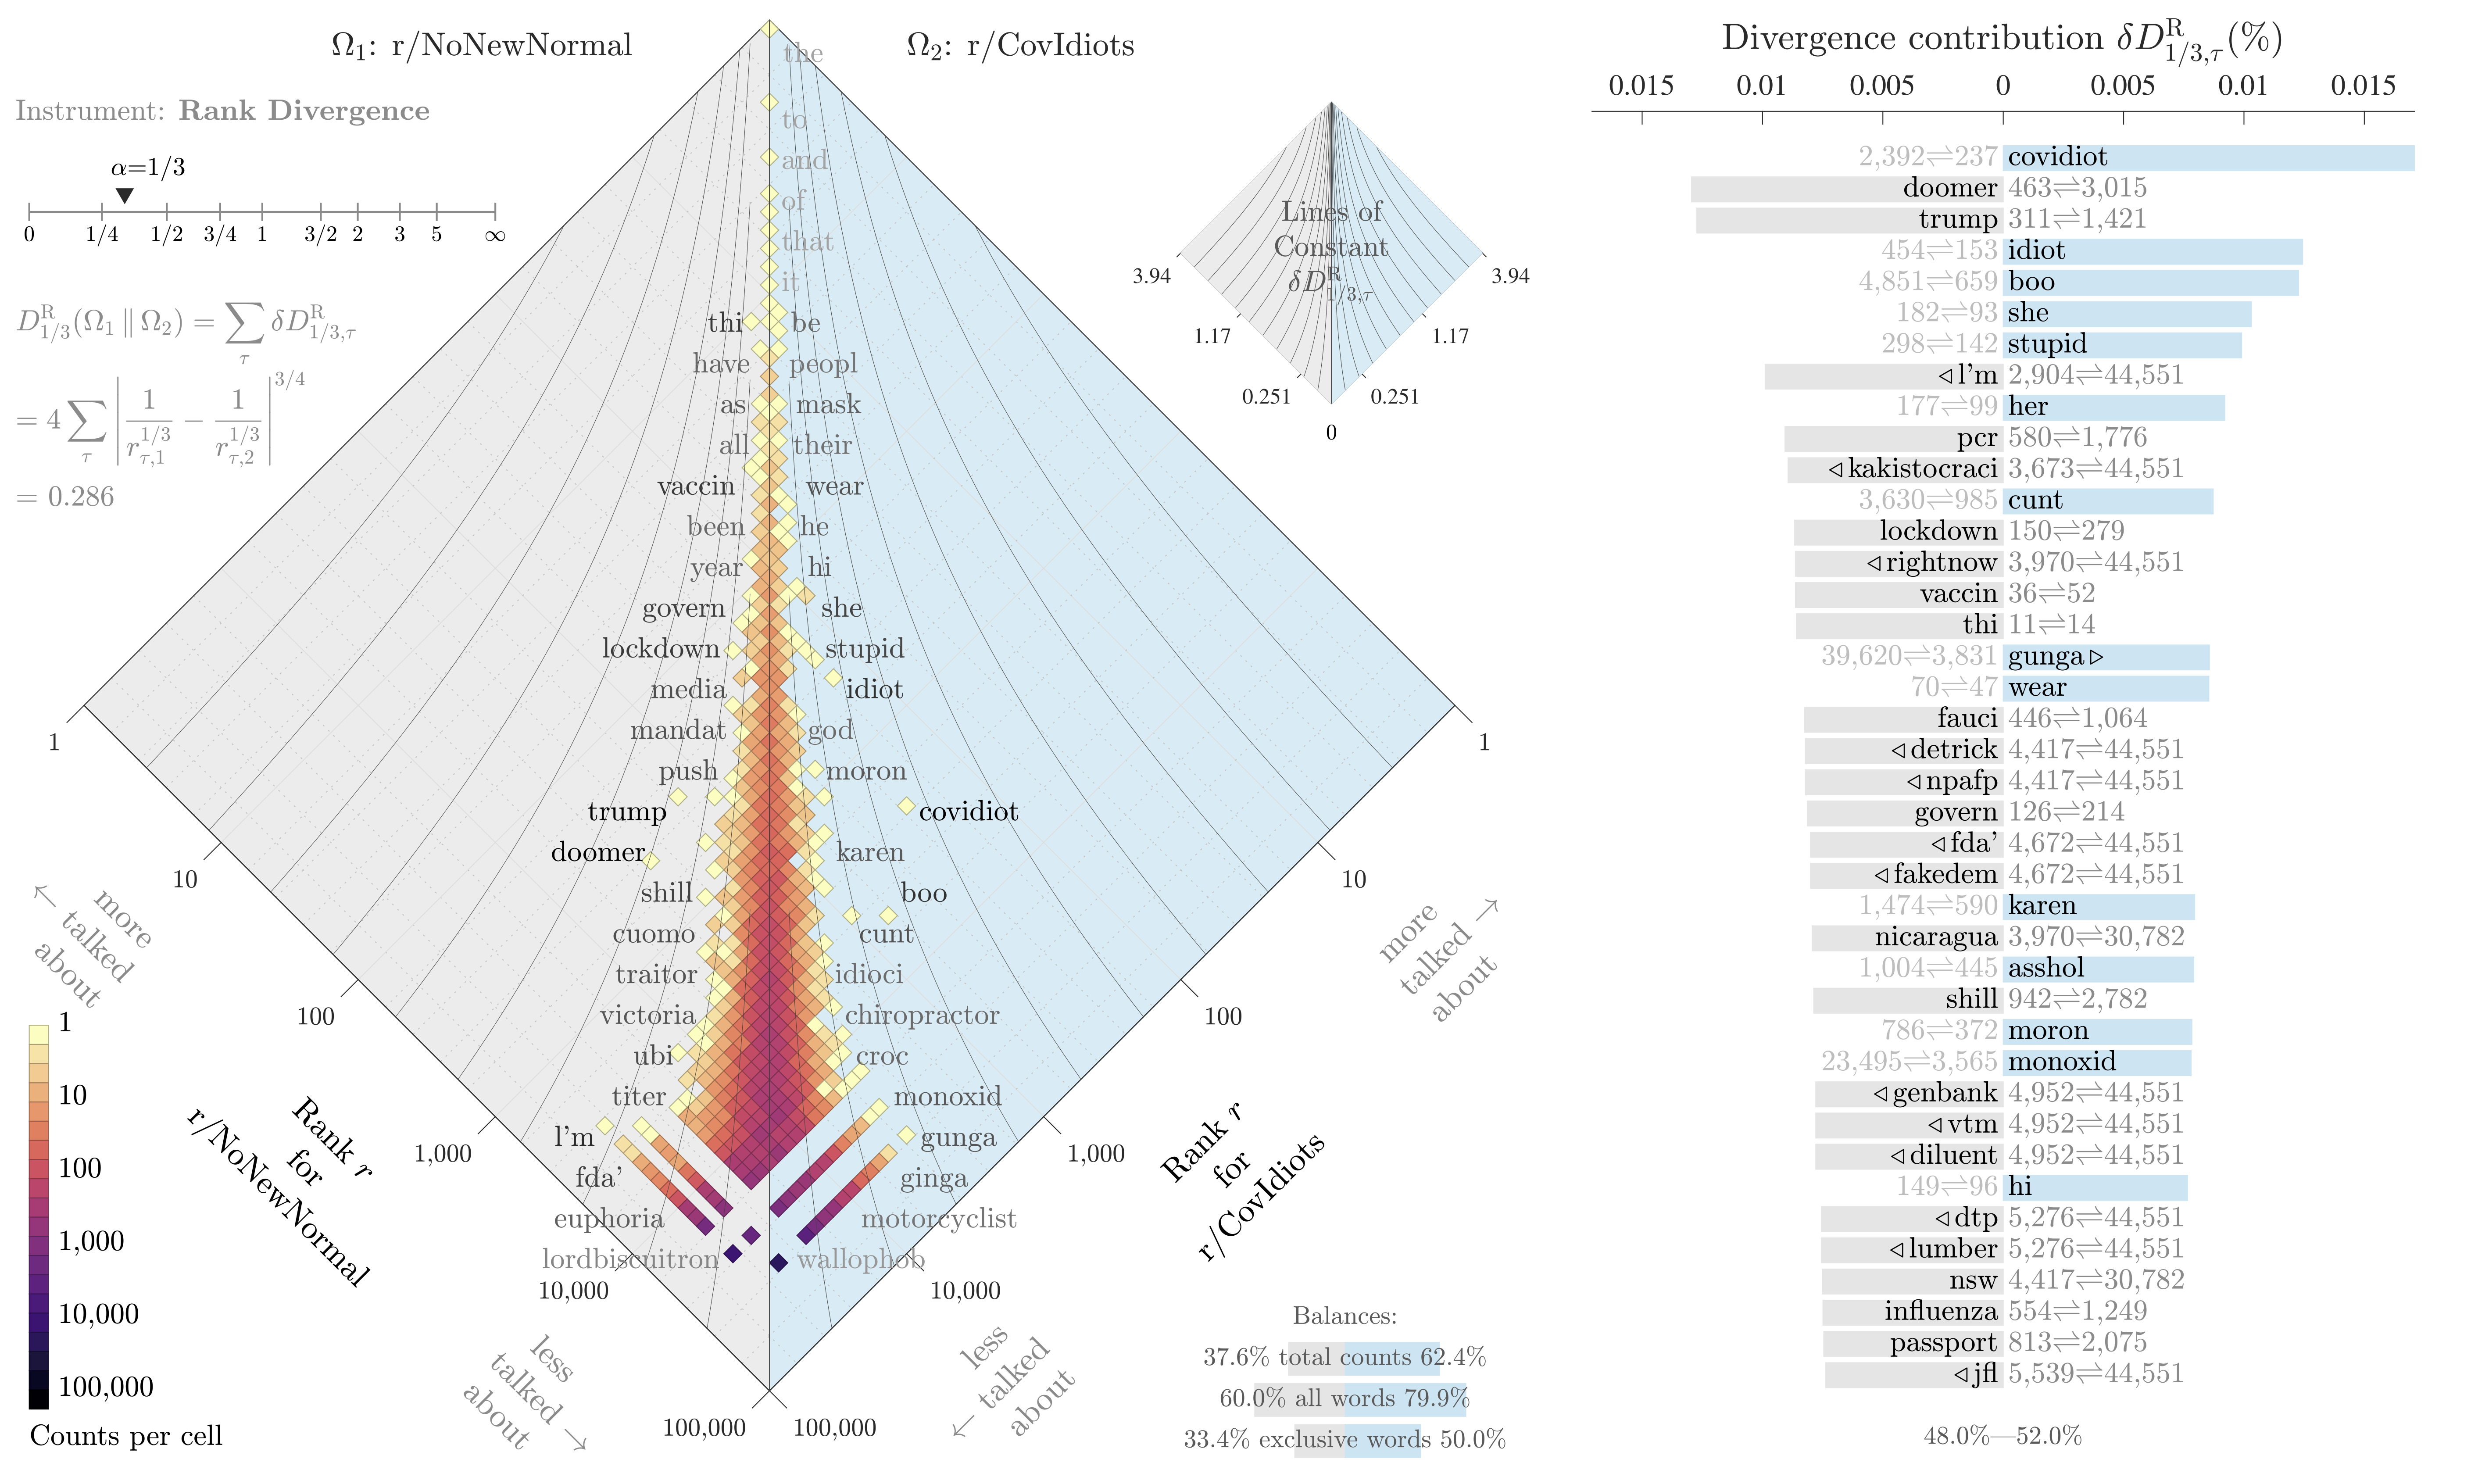
The “divergence contribution” plot on the right can be read like Shifterator’s JSD plot, and simply lists the most divergent terms and which text they appear more in. The allotaxonometry plot on the left reads like a scatterplot, where one axis is the rank of words in r/NoNewNormal and the other axis is the rank of words in r/CovIdiots. When words have the same rank in both texts they’ll appear on the center line, and the more they skew towards one subreddit or another the further out they’ll be plotted. Only a small subset of notable words are explicitly labeled, and the rest of the plot operates more like a heatmap to give a sense of how divergent the two texts are and whether that divergence starts with common words or only after the first thousand or so.
The plot highlights r/NoNewNormal’s focus on lockdowns, doomerism, and political figures like Trump and Fauci, while CovIdiots has a lot more insulting language. The plot correctly buries shared terms like “the” and common focuses like “covid”. That plot comes from one of my research papers, which I discuss in more detail here.
Conclusions
This about runs the gamut from relatively simple but clumsier metrics (tf-idf, proportion shifts) to highly configurable and more involved tools (RTD). The appropriate tool depends on the data - are there enough documents with enough distinct words that tf-idf easily finds a pattern? Splendid, no need to break out a more sophisticated tool. Communicating with an audience that’s less mathy? Maybe a proportion shift will be easier to explain. You have lots of noisy data and aren’t finding a clear signal? Time to move to JSD and RTD.
All of these tools only concern individual word counts. When identifying patterns in text we are often interested in word associations, or clustering many similar words together into topic categories. Tools for these tasks, like Latent Dirichlet allocation and topic modeling with Stochastic Block Models, are out of scope for this post. Word embeddings, and ultimately transformer models from Bert to ChatGPT, are extremely out of scope. Maybe next time.
Academic Funding on Fire
Posted 5/17/2025
I’m now a postdoc involved in applying for research funding, and have more insight into the process than I did as a graduate student. Given horrifying cuts to funding throughout academia, I wanted to share my perspective with non-academic readers.
Where Does Research Funding Come From?
In corporate research and development, funding comes from the business’ revenue or investors and is driven by product development. In academia, things are a little more varied. Academic funding typically comes from government grants, philanthropists, and corporate partnerships.
Government grants come from agencies like the National Science Foundation (NSF), National Institutes for Health (NIH), Department of Energy (DoE), Department of Defense (DoD), and so on. Each agency has a broad mandate, issues calls for projects on topics within their mandate, and awards money to project proposals they find promising.
Philanthropists include the Gates Foundation, the Chan-Zuckerberg Initiative, the Sloan Foundation, and other charitable groups. These groups often have much narrower mandates than their federal counterparts - for example, the National Science Foundation funds fundamental research and education that they hope will lay the groundwork for future applied studies, while philanthropic charities are likely to fund more immediately applied work related to eradicating disease or other topics of interest.
Corporate partnerships are often narrower and more directly applied than even philanthropic funding. For example, Google funded some of my research into the longevity of open source software. Many Google products are built upon open source software, and they want to be confident that those building blocks are being actively maintained and aren’t likely to be abandoned due to lack of funding or founder burnout. Clear utility to them, of interest to us, win-win.
While the prominence of funding sources varies between fields, in most disciplines the vast majority of funding comes from government grants.
What do Grants Look Like?
Scientists apply for grants by proposing a project or series of projects under an advertised call for proposals. Along with the description of the research and an argument for why it’s valuable, each grant has a budget including:
-
Salaries for professors, postdocs, graduate students, and other research staff working on the project
-
Equipment (computers, software, fancy microscopes, you name it)
-
Travel and publishing costs (for fieldwork, attending conferences, open-access publication fees, and so on)
Once research staff have their salaries covered by a grant, they may work on additional projects without funding. This is entirely normal for letting students explore their own interests, and helps with future grant funding. Scientists often apply for grants to support projects they started unpaid, using their preliminary results to justify funding and allocating more resources to the work. In this way scientists are always a little out of sync, using existing grant funding to support both the grant’s work and the groundwork for the next grant.
Indirect Costs
Before the scientists apply for a grant, the university amends the budget to add indirect costs. This overhead covers expenses that support all research indirectly but don’t fit neatly into an individual research budget. For example, building maintenance, and covering human resources, accountants, janitorial staff, electricity, and so on. These indirect costs vary between universities, but often exceed 50% - meaning half the grant money awarded will go to the university rather than the specific research project.
Philanthropists often put strict limits on indirect costs, frequently 15%. If your mission is to eradicate Ebola, you don’t want to report back to Bill and Melinda Gates that half your budget went to university administrators and libraries. This puts universities in an awkward position - they need those indirect costs to cover operations, but don’t want to turn down free money from a private foundation. The typical compromise is to use indirect costs from federal grants to cover the university’s overhead needs, then take what they can get from the philanthropists.
It’s all Burning Down
The Trump administration has frozen (then unfrozen, then refrozen, then-) grant awards from the National Institutes for Health and the National Science Foundation. They’ve cut countless existing grants, retracting already awarded funding mid-project.
Academics are pivoting from federal funding to philanthropy and corporate partnerships, but this presents two problems: first, there isn’t nearly enough private funding to replace federal shortfalls, and second, these grants often have the aforementioned 15% indirect cost cap, and so provide much less money to universities.
More recently, Republicans in Congress proposed capping federal grant indirect costs at 15% under the argument that universities clearly get by on low indirect costs from charities, so why can’t they do the same with government grants? This of course misses that government grant overheads have been supplementing charity grants, and so capping federal indirect costs would be devastating.
In any case, the academic funding situation is dire. Even if these policies were all reversed tomorrow, there’s a long lead time on starting new studies, hiring scientists, and some research (especially medical studies) can’t just be paused and restarted with fluctuating funding. Add to that all the scientists leaving the United States to seek more reliable work elsewhere, and American academia is committed to a downward spiral for quite a while.
Dungeon Generation with Binary Space Partitioning
Posted 5/11/2025
It’s a lazy Sunday afternoon, and I’ve been thinking about procedural dungeon generation. This is a challenge where we build algorithms to create maps suitable for video- or tabletop-games, such that the maps are random enough to provide some surprise and variety, and constrained enough to produce playable maps with coherent structure. There are many, many approaches to this problem, and today I’m going to write about one of the simplest.
The Setting
Rather than generating forests, caves, or towns, we’re going to generate a traditional dungeon in the style of Rogue: a series of underground rooms, connected by passageways. Here’s one such example from Nethack rendered as traditional ASCII-art, featuring eight rooms, staircases up and down (< and >), our hero (@), and our trusty cat (f):
          -----
          |...|         -------                           -----
          |...|        #.......########################  #.....##
          |...|        #|.....|                       #  #|...| #
          |....#####   #|.....-###     ------------   ## #|...| #
          |...|    #####-<....|  ###   |...........   ####|...| #
          ---.-      #  |.....|    ### ...........|    ###----- ###-----------
             #      ##  -------     ## |..........-###   ######   #-.........|
             #      #             #####...........|  #      #      |.........|
             #      #      #     ##    ------------  ##     #      |.........|
             #      #  #######   #                   #####  #      |.........|
           ###      #  #---.---- #                    #-|-.-#      |.........|
         --.------  #  #|>...f.|##                    #.....#      |.........|
         |.......|###  #|...@..| #                     |...|       -----------
         |........######|.......##                     |...|
         |.......|#     ------.-                       |...|
         |........#           #                        -----
         ---------
So, we need a series of non-overlapping rectangles of a variety of sizes, and paths between the rectangles so as to guarantee any room can be reached from any other. We’d also like some locality: rooms should typically link to other nearby rooms, only rarely producing long corridors that stretch across the map. Other details, like giving corridors twists and dead-ends, we’ll leave off for now in the name of simplicity.
The Algorithm
Today we’ll be using Binary Space Partitioning, a general purpose technique often used in computer graphics, collision-prediction in robotics, and other scenarios where diving up a physical space is useful. Here’s the approach, described in terms of our problem:
-
Begin with a rectangle the size of the entire map
-
Choose whether to cut the rectangle vertically or horizontally
-
Choose a random cut-position along the x- or y-axis (according to step 2) such that the two child-rectangles are both above a minimum size - if no such cut is possible, stop
-
Repeat step two on each child-rectangle
This recursive algorithm lets us break up one big rectangle into several smaller adjoining rectangles. For an arbitrary visualization, here’s a 100x100 rectangle, broken into smaller pieces so long as those pieces are at least 10x10:
We can visualize this rectangle cutting algorithm using a tree, which traces our recursive function calls:
Converting the Graph to a Dungeon
We have adjoining and non-overlapping rectangles, but these don’t look like rooms yet. To generate rooms we want to shrink our rectangles and add some buffer space between neighbors. For each leaf on the original graph, r1 through r12, let’s generate a rectangle with random dimensions between a minimum width and height of 10, and a maximum width and height of its parent rectangle minus two (for the borders). Then we’ll place the new rectangle randomly within the confines of its parent:
Okay, we have rooms! How about corridors? Here we’ll make use of our tree structure: once we’ve reached the bottom of the tree and placed a room in our rectangle, we’ll start returning back up the recursive tree. At each parent node we’ll randomly select a room from each child branch, and add an edge between them.
Here’s an example process for the dungeon we’ve been illustrating:
-
r3 and r4 are sibling rooms at the bottom of a branch, so at the cut node above them we will add an edge between r3 and r4
-
At the parent cut node we’ll select a random room from the left branch (r3 or r4) and a random room from the right branch (only r2 is available) and add an edge between them - we’ve connected r2 and r3
-
At the parent cut node we’ll select a random room from the left (r2, r3, or r4) and a random room from the right (r1) and add an edge between them - we’ve connected r1 and r3
-
At the parent cut node we’ll select a random room from the left (r1 through r4) and a random room from the right (r5 through r12) and add an edge between them - we’ve connected r1 and r7
The result looks like:
Note that a few paths overlap: r6 and r7 are connected, but the path is obscured by r1-r7 and r6-r10. The path from r1 to r7 intersects both r3 and r5. These collisions are desirable in our application, because they increase the diversity of room configurations - r3 has five doors, despite only being explicitly connected to three neighboring rooms.
Adding some Frills
We have a minimum-viable dungeon! Rooms of variable size, in a fully connected graph, mostly connecting nearby rooms to one another. Pretty bare-bones, but not bad for under 70 lines of Python. There’s lots more we could do from here: we could add some turbulence to paths, so that they sometimes zig-zag or move more diagonally between rooms. We could delete a room or two and part of its edges to introduce dead-ends - but we’d need to be careful to delete only rooms with a maximum degree of one to avoid disconnecting parts of the dungeon. We could introduce some shapes besides rectangles - perhaps one room represents a theater or Colosseum and should be elliptical. Until now we have only considered the structure of the map, but we can now add constraints to assign the purpose and contents of each room. Some example rules might include:
-
Rooms of a large size have a chance to be merchant halls or city centers
-
Rooms of moderate size, a skewed width to height ratio, and a maximum of two exits may be barracks
-
Small rooms adjoining a barracks may be an armory
-
Small rooms with only one doorway may be storehouses
-
Moderately sized single-exit rooms rooms may be shops
-
Distant rooms may be goblin dens, and have tunnels rather than corridors
Coloring rooms by their assigned purpose, swapping out r5 for an elliptical town center, and indicating that the path from r3 to r4 should be a roughly hewn tunnel yields a map with slightly more life in it:
Conclusion
Not much in the way of conclusion! This was fun to play with, and my main code is here if anyone wants to take a look.
What is NP? Why is NP?
Posted 12/11/2024
This post is about theoretical computer science. I’ve written it without getting too far into academic vocabulary, but this is a disclaimer that if thinking about Turing machines sounds dry as sand, this will not be the post for you.
In computer science we are often interested in how difficult a problem is, defined by how the number of steps required to solve a problem scales up as the size of the problem increases. We also use this kind of asymptotic analysis to discuss how well an algorithm scales, something I have written about before. I ended that post by discussing problem complexity classes, and especially three groups of interest:
-
P - the set of decision problems that can be solved in polynomial time or better, meaning they are relatively approachable
-
NP - the set of decision problems that can have their solutions verified in polynomial time or better, but may be much slower to solve
-
NP-Hard - the set of decision problems at least as hard as the hardest NP problems (which we refer to as NP-Complete), meaning this category also includes problems that cannot be verified in polynomial time
However, there is a second way to define NP: the set of all problems that can be solved in polynomial time by a Non-Deterministic Turing Machine. This is in fact where the name comes from, “Nondeterministic, Polynomial time.” In my undergraduate foundations class we glossed over this equivalent definition as a footnote and focused on “if you can verify in polynomial-time it’s in NP.” I never understood how this non-deterministic definition worked or why the two are equivalent, so many years later I’m digging in.
What in the world is a ‘Non-Deterministic Turing Machine?’
First, a quick refresher: A Turing Machine is a simple model of computation. It’s a theoretical machine that has an “input” (idealized as a tape of symbols drawn from a finite alphabet), and a current state from a finite list of states. The machine can do things like move the tape forward and backward so the tape head points at a different position, read symbols, write symbols, and change the current state.
A typical deterministic Turing Machine can only take one particular action given a particular state and input. Since its action is wholly determined by the state and input, it’s deterministic. Therefore, a non-deterministic Turing Machine (NTM hereafter) is one that can take multiple actions given a particular state and input.
So how do we evaluate an NTM if it can take more than one action at any given step? We usually think of an NTM as a branching process, where it executes all possible actions concurrently, perhaps in parallel universes. Then, once one path of the NTM leads to a result, we return that one resulting path and discard the other branches of the evaluation tree. Another way of thinking about this is that the NTM always guesses perfectly which of its available actions to take to yield a result in as few steps as possible.
As an example, imagine a breadth-first search on a square graph where you can move up, down, left, and right. We can represent the first two steps of such a search in an evaluation tree, as follows:
A deterministic Turing Machine evaluates each node in the evaluation tree one by one; that is, it evaluates “left, right, down, up,” then “left left, left right, left down, left up,” and so on. Therefore, the runtime of the breadth-first search scales with the size of the evaluation tree, which grows exponentially. However, a non-deterministic Turing machine evaluates each of its possible paths concurrently (or alternatively, always guesses which step to take correctly). It evaluates the first four moves in one parallel step, then all sixteen second steps in a second parallel step. Therefore, the number of steps a deterministic TM needs scales with the total number of nodes in the tree, but the steps an NTM needs scales only with the depth of the evaluation tree.
Note that when the NTM returns its answer - a path from the start to end point on the graph, as highlighted above - a verifier walks through that single path step by step. The verifier doesn’t need to make any complex decisions or multiple branching actions per input, it just reads one step at a time in the path, confirms that they’re valid steps for the search, and that the start point and end points of the path are correct. Therefore, the verifier can always be a deterministic Turing machine.
So, if the depth of the evaluation tree scales polynomially with the input size then an NTM will be able to solve the problem in polynomial time - and a TM will be able to verify that same answer in polynomial time. That’s why the two definitions of NP are equivalent.
Why frame complexity classes this way?
Okay, so that’s why we can describe NP problems in terms of a rather impractical non-deterministic Turing Machine, but what’s the advantage of doing so? Remember that there are two ways of evaluating a non-deterministic Turing Machine: we can think of each possible action for an input executing “in parallel” and then discarding the false paths once a solution is found, or we can think about the Turing Machine always correctly “guessing” the action that will lead to an answer in the shortest number of steps. Using this second definition we can frame anything beyond NP as “even if you guessed the right action to take at every step and bee-lined towards a solution, the runtime would still increase exponentially with the input size.”
Now P is the set of problems we can solve in polynomial time with no guesswork, NP consists of problems we can solve in polynomial time with perfect guesswork at each step, and anything beyond NP can’t be solved in polynomial time even with perfect guesswork.
Open Academic Publication
Posted 10/28/2023
I’m currently at a workshop on open practices across disciplines, and one topic of discussion is how to change the academic publishing process to be more accessible to both authors and readers. I’ve also had a few friends outside of academia ask me how publishing research papers works, so it’s a good opportunity to write a post about the messy world of academic publishing.
The Traditional Publication Model
Academics conduct research, write an article about their findings, and submit their article to an appropriate journal for their subject. There it undergoes review by a committee of peer researchers qualified to assess the quality of the work, and upon acceptance, the article is included in the next issue of the journal. In a simple scenario, the process is illustrated by this flowchart:
Libraries and research labs typically pay journals a subscription fee to receive new issues. This fee traditionally covered publication expenses, including typesetting (tedious for papers with lots of equations and plots and diagrams), printing, and mail distribution, along with the salaries of journal staff like editors, who are responsible for soliciting volunteer peer-reviews from other academics. These subscription fees were long considered a necessary evil: they limit the ability of low-income academics to access published research, such as scientists at universities in developing countries, let alone allowing the public to access research, but we all agree that printing and distributing all these journal issues has some significant financial overhead.
In recent decades, all significant journals have switched to majority or exclusively digital distribution. Academics do most of the typesetting themselves with LaTeX or Microsoft Word templates provided by the journals, and there’s no printing and negligible distribution costs for hosting a PDF online, so publication fees now go largely to the profit margins of publishers. This has made academic publishing ludicrously profitable, with margins as high as 40% in a multi-billion dollar industry.
The Shift to Open Publishing
Academics complain bitterly that journal publishers are parasitic, charging exorbitant publication fees while providing almost no service. After all, research is conducted by academics and submitted to the publishers for free. Other academics review the research, also for free, as peer-review is considered expected community service within academia. Since academics are typically funded by government agencies (such as the National Science Foundation, Department of Energy, and Department of Defense in the United States), this is taxpayer-funded public research, whose distribution is being limited by publishers rather than facilitated by them.
As journal subscription costs grew, these complaints eventually evolved into threats by universities to cancel their journal subscriptions, and funding agencies like the NSF began to demand that work they fund be made publicly accessible. The publisher profit margins were endangered, and they needed to act quickly to suppress dissent.
Many publishers now offer or require an alternative publishing scheme: Open Access. Under Open Access, articles can be read for free, but academics must pay to have their work published in order to cover staff salaries and the burdensome cost of web-hosting PDFs. This not only protects the revenue stream of publishers, but can expand it dramatically when journals like Nature Neuroscience charge $11,690 per article.
![]()
While Open Access allows academics with fewer resources to read scholarly work from their peers, and allows the public to read academic papers, it also inhibits academics with less funding from publishing if they can’t afford the publication fees. Further, it provides an incentive for publishers to accept as many papers for publication as possible to maximize publication fees, even if these papers are of lower quality or do not pass rigorous peer-review. When journals are paid under a subscription model they make the same income whether a new issue has ten or a hundred articles in it, and so it is more profitable to be selective in order to maximize the ‘prestige’ of the journal and increase subscriptions.
What Can Be Done?
Academic research remains constrained by publishers, who either charge a fortune before publication, or after, while providing minimal utility to academia. These costs disproportionately impact researchers with less funding, often those outside North America and Europe. The most obvious solution to this problem might be “replace the journals with lower-cost alternatives,” but this is easier said than done. Even if we could find staff to organize and run a series of lower-cost journals, there’s a lot of political momentum behind the established publishers. Academics obtain grant funding, job offers, and tenure through publishing. Successful publishing means publishing many papers in prestigious journals and getting many citations on those papers. A new unproven journal won’t replace a big name like Nature or Science any time soon in the eyes of funding agencies and tenure committees, and will take time to gather a loyal readership before papers in it receive many reads or citations. While I hope for eventual reform of journals and academic institutional practices at large, a more immediate solution is needed.
Collective Bargaining
One option is to simply pressure existing journals into dropping fees. If enough universities threaten to cut their subscriptions to major journals, then publishers will have no choice but to lower subscription costs or Open Access publication fees and accept a lower profit margin. This strategy has seen some limited success - some universities are cutting their contracts with major publishers, perhaps most notably when the University of California system ended their subscription to all Elsevier journals in 2019. However, this strategy can only work if researchers have leverage. Elsevier is the worst offender, and so universities can cut ties and push their researchers to publish in competitor journals from Springer or SAGE, but the costs at those competitor publishers remains high.
Preprints
Physicists popularized the idea of a “preprint.” Originally this consisted of astrophysicists emailing rough drafts of their papers to one another. This had less to do with publication fees and more to do with quickly sharing breakthroughs without the delays that peer-review and publication incurs. Over time, the practice shifted from mailing lists to centralized repositories, and grew to encompass physics, mathematics, computer science, quantitative biology, quantitative finance, statistics, electrical engineering and systems science, and economics. That preprint service is called arXiv. This effort has been replicated in other fields, including bioRxiv, ChemRxiv, medRxiv, and SocArXiv, although preprint usage is not common in all fields.
![]()
Papers submitted to preprint servers have not undergone peer-review, and often have little to no quality control - the moderators at arXiv will give a paper a quick glance to remove obvious spam submissions, but they have neither the resources nor the responsibility to confirm that research they host is of high quality or was conducted ethically. Preprint papers were always intended to be rough drafts before publication in real journals, not a substitution for publication. Nevertheless, it is common practice for scholars to bypass journal paywalls by looking for a preprint of the same research before it underwent peer-review, so in practice preprint servers already serve as an alternative to journal subscriptions.
Shadow Libraries
The direct action counter to journal subscription fees is to simply pirate the articles. Sci-Hub and Library Genesis (URLs subject to frequent change) acquire research papers and books, respectively, and host them as PDFs for free, ignoring copyright. Both shadow libraries have been sued for copyright infringement in several jurisdictions, but have rotated operations between countries and have so far avoided law enforcement.

Use of Sci-Hub is ubiquitous in STEM-academia, and is often the only way that researchers can access articles if they have limited funding or operate out of sanctioned locations, such as Russia during the Russia-Ukraine war. Sci-Hub’s founder, Alexandra Elbakyan, considers the site’s operations to be a moral imperative under the Universal Declaration of Human Rights, which guarantees all human beings the right to freely share in scientific advancements and their benefits. Whether or not you agree with Elbakyan’s stance, it seems clear that a combination of shadow libraries and preprint services have undermined the business models of traditional academic publishers and made them more amenable to alternatives like Open Access, and more susceptible to threats by universities to end subscriptions.
What Comes Next?
Academic publishing is approaching a crisis point. Research funding in most disciplines is scarce, and journal subscription or publication fees are steadily increasing. The number of graduate and postgraduate researchers is growing, guaranteeing an accelerating rate of papers, straining publication fees and the peer-review system even further. Academics have tolerated the current system by using preprints and shadow libraries to share work without paying journals, but these are stopgaps with a range of shortcomings. If academic research is to flourish then we will see a change that lowers publication costs and perhaps relieves strain on peer reviewers, but what that change will look like or how soon it will come remains open to debate.
When is a network “decentralized enough?”
Posted 08/08/2023
I’ve submitted a new paper! Here’s the not-peer-reviewed pre-print. This post will discuss my work for non-network-scientist audiences.
There is broad disillusionment regarding the influence major tech companies have over our online interactions. Social media is largely governed by Meta (Facebook, Instagram, Whatsapp), Google (YouTube), and Twitter. In specific sub-communities, like open source software development, a single company like GitHub (owned by Microsoft) may have near-monopolistic control over online human collaboration. These companies define both the technology we use to communicate, and thereby the actions we can take to interact with one another, and the administrative policies regarding what actions and content are permissible on each platform.
In addition to debates over civic responsibility and regulation of online platforms, pushback to the centralized influence of these companies has taken two practical forms:
-
Alt-Tech. Communities that are excluded from mainstream platforms, often right-wing hate and conspiracy groups, have built an ecosystem of alternative platforms that mirrors their mainstream counterparts, but with administrations more supportive of their political objectives. These include Voat and the .Win-network (now defunct Reddit-clones), BitChute and Parler (YouTube-clones), Gab (Twitter-clone), and many others.
-
The Decentralized Web. Developers concerned about centralized control of content have built a number of decentralized platforms that aim to limit the control a single entity can have over human communication. These efforts include Mastodon, a Twitter alternative consisting of federated Twitter-like subcommunities, and ad-hoc communities like a loose network of self-hosted git servers. The decentralized web also encompasses much older decentralized networks like Usenet and email, and bears similarity to the motivations behind some Web3 technologies.
It is this second category, of ostensibly self-governed online communities, that interests me. Building a community-run platform is a laudable goal, but does the implementation of Mastodon and similar platforms fall short of those aspirations? How do we measure how ‘decentralized’ a platform is, or inversely, how much influence an oligarchy has over a platform?
The Community-Size Argument
One common approach to measuring social influence is to examine population size. The largest three Mastodon instances host over half of the entire Mastodon population. Therefore, the administrators of those three instances have disproportionate influence over permitted speech and users on Mastodon as a whole. Users who disagree with their decisions are free to make their own Mastodon instances, but if the operators of the big three instances refuse to connect to yours then half the Mastodon population will never see your posts.
A size disparity in community population is inevitable without intervention. Social networks follow rich-get-richer dynamics: new users are likely to join an existing vibrant community rather than a fledgling one, increasing its population and making it more appealing to future users. This is fundamentally a social pressure, but it is even further amplified by search engines, which are more likely to return links to larger and more active sites, funneling potential users towards the largest communities.
But is size disparity necessarily a failure of decentralization? Proponents of Mastodon have emphasized the importance of small communities that fit the needs of their members, and the Mastodon developers have stated that most Mastodon instances are small, topic-specific communities, with their mastodon.social as a notable exception. If smaller communities operate comfortably under the shadow of larger ones, perhaps this is a healthy example of decentralized governance.
Before exploring alternative methods for measuring social centralization, let’s compare a few of these decentralized and alt-tech platforms using the lens of community size. Below is a plot of sub-community population sizes for five platforms.
The y-axis represents the population of each community as a fraction of the largest community’s size. In other words, the largest community on each platform has a size of “1”, while a community with a tenth as many users has a size of “0.1”. The x-axis is what fraction of communities have at least that large a population. This allows us to quickly show that about 2% of Mastodon instances are least 1% the size of the largest instance, or alternatively, 98% of Mastodon instances have fewer than 1% as many users as the largest instance.
This puts Mastodon in similar territory as two centralized platforms, BitChute and Voat. Specifically, the number of commenters on BitChute channels follows a similar distribution to Mastodon instance sizes, while the distribution of Voat “subverse” (analogous to “subreddits”) populations is even more skewed.
By contrast, the number of users on self-hosted Git servers (the Penumbra of Open-Source), and unique authors on Polish Usenet newsgroups, is far more equitable: around a third of git servers have at least 1% as many users as the largest, while the majority of newsgroups are within 1% of the largest.
Inter-Community Influence
If smaller communities exist largely independently of larger ones, then the actions of administrators on those large communities does not matter to the small community, and even in the face of a large population disparity a platform can be effectively decentralized. How can we measure this notion of “independence” in a platform-agnostic way such that we can compare across platforms?
Each of the five platforms examined above has some notion of cross-community activity. On Mastodon, users can follow other users on both their own instance and external instances. On the other four platforms, users can directly participate in multiple communities, by contributing to open source projects on multiple servers (Penumbra), or commenting on multiple channels (BitChute), subverses (Voat), or newsgroups (Usenet).
In network science terminology, we can create a bipartite graph, or a graph with two types of vertices: one for communities, and one for users. Edges between users and communities indicate that a user interacts with that community. For example, here’s a diagram of Mastodon relationships, where an edge of ‘3’ indicates that a user follows three accounts on a particular instance:
This allows us to simulate the disruption caused by removing an instance: if mastodon.social went offline tomorrow, how many follow relationships from users on kolektiva.social and scholar.social would be disrupted? More globally, what percentage of all follow relationships by remaining users have just been pruned? If the disruption percentage is high, then lots of information flowed from the larger community to the smaller communities. Conversely, if the disruption percentage is low, then users of the smaller communities are largely unaffected.
Here is just such a plot, simulating removing the largest community from each platform, then the two largest, three largest, etcetera:
From this perspective on inter-community relationships, each platform looks a little different. Removing the largest three Mastodon instances has a severe effect on the remaining population, but removing further communities has a rapidly diminished effect. Removing Usenet newsgroups and BitChute channels has a similar pattern, but less pronounced.
Voat and the Penumbra require additional explanation. Voat, like Reddit, allowed users to subscribe to “subverses” to see posts from those communities on the front page of the site. New users were subscribed to a set of 27 subverses by default. While the two largest subverses by population (QRV and 8chan) were topic-specific and non-default, the third largest subverse, news, was a default subverse with broad appeal and high overlap with all other communities. Therefore, removing the largest two communities would have had little impact on users uninvolved in QAnon discussions, but removing news would impact almost every user on the site and cuts nearly 10% of interactions site-wide.
The Penumbra consists of independently operated git servers, only implicitly affiliated in that some developers contributed to projects hosted on multiple servers. Since servers are largely insular, most developers only contribute to projects on one, and so those developers are removed entirely along with the git server. If a user contributed to projects hosted on two servers then disruption will increase when the first server is removed, but will decrease when the second server is removed, and the developer along with it. This is shown as spiky oscillations, where one popular git server is removed and drives up disruption, before another overlapping git server is removed and severs the other side of those collaborations.
Sometimes you may be uninterested in the impact of removing the largest 2, 3, or 10 instances, and want a simple summary statistic for whether one platform is “more centralized” than another. One way to approximate this is to calculate the area under the curve for each of the above curves:
This scores Mastodon as the most centralized, because removing its largest instances has such a large effect on its peers. By contrast, while the Voat curve is visually striking, it’s such a sharp increase because removing the largest two communities doesn’t have a large impact on the population.
Situating Within Network Science
“Centralization” is an ill-defined term, and network scientists have a range of ways of measuring centralization for different scenarios. These metrics fall into three broad categories:
| Scale | Description | Examples |
|---|---|---|
| Vertex | Measures how central a role a single node plays in the network | Betweenness centrality, Eigenvector centrality |
| Cluster | Measures aspects of a particular group of vertices | Assortativity / Homophily, Modularity, Insularity / Border index |
| Graph | A summary attribute of an entire graph | Diameter, Density, Cheeger numer |
These metrics can capture aspects of centrality like “this vertex is an important bridge connecting two regions of a graph” or “this vertex is an important hub because many shortest paths between vertices pass through it.” They can measure how tight a bottleneck a graph contains (or, phrased another way, how well a graph can be partitioned in two), they can measure how much more likely similar vertices are to connect with one another, or how skewed the degree distribution of a graph is.
However, these metrics are mostly intended for fully connected unipartite graphs, and do not always have clear parallels in disconnected or bipartite graphs. Consider the following examples:
Many would intuitively agree that the left-most graph is central: one community in the center is larger than the rest, and serves as a bridge connecting several other communities together. By contrast, the middle graph is decentralized, because while the communities aren’t all the same size, none are dramatically larger than one another, and none serve a critical structural role as a hub or bridge.
The graph on the right is harder to describe. One community is much larger than its peers, but the remaining graph is identical to the decentralized example. By degree distribution, the graph would appear to be centralized. If we add a single edge connecting the giant community to any user in the main graph, then the giant community’s betweenness centrality score would skyrocket because of its prominent role in so many shortest-paths between users. However, it would still be inappropriate to say that the largest community plays a pivotal role in the activity of the users in the rest of the graph - it’s hardly connected at all!
My disruption metric is a cluster-level or mesoscale measurement for bipartite graphs that measures the influence of each community on its peers, although you can calculate the area under the disruption curve to make a graph-scale summary statistic. Using this approach, the centralized community is decidedly centralized, and the decentralized and ambiguous graphs are decidedly not.
Takeaways
Community size disparity is natural. Some communities will have broader appeal, and benefit from more from rich-get-richer effects than their smaller, more focused peers. Therefore, even a thriving decentralized platform may have a highly skewed population distribution. To measure the influence of oligarchies on a platform, we need a more nuanced view of interconnection and information flow between communities.
I have introduced a ‘disruption’ metric that accounts for both the size of a community and its structural role in the rest of the graph, measuring its potential influence on its peers. While the disruption metric illustrates how population distributions can be deceptive, it is only a preliminary measurement. Follows across communities and co-participation in communities are a rough proxy for information flow, or a network of potential information flow. A more precise metric for observed information flow might measure the number of messages that are boosted (“retweeted”) from one Mastodon instance to another, or might measure how frequently a new discussion topic, term, or URL appears first in one community, and later appears in a “downstream” community.
Does population size correlate with these measurements of information flow and influence? Are some smaller communities more influential than their size would suggest? How much does the graph structure of potential information flow predict ‘social decentralization’ in practice? There are many more questions to explore in this domain - but this is a start!
AntNet: Networks from Ant Colonies
Posted 08/07/2023
Ant nests look kind of like networks - they have rooms, and tunnels between the rooms, analogous to vertices and edges on a graph. A graph representation of a nest might help us answer questions about different ant species like:
-
Do some species create more rooms than others?
-
Do some species have different room layouts, such as a star with a central room, or a main corridor rooms sprout off of, closer to a random network, or something like a small-world network?
-
Do some species dig their rooms deeper, perhaps to better insulate from cold weather, or with additional ‘U’ shaped bends to limit flooding in wetter climates?
I’m no entomologist, and I will not answer those questions today. I will however, start work on a tool that can take photos of ant farms and produce corresponding network diagrams. I don’t expect this tool to be practical for real world research: ant farms are constrained to two dimensions, while ants in the wild will dig in three, and this tool may miss critical information like the shapes of rooms. But it will be a fun exercise, and maybe it will inspire something better.
A picture’s worth a thousand words
We’ll start with a photo of an ant farm, cropped to only include the dirt:

I want to reduce this image to a Boolean map of where the ants have and have not excavated. For a first step, I’ll flatten it to black and white, adjusting brightness and contrast to try to mark the tunnels as black, and the remaining dirt as white. Fortunately, ImageMagick makes this relatively easy:
convert -white-threshold 25% -brightness-contrast 30x100 -alpha off -threshold 50% original.png processed.png

Clearly this is a noisy representation. Some flecks of dirt are dark enough to flatten to ‘black,’ and the ants have left some debris in their tunnels that appear ‘white.’ The background color behind the ant farm is white, so some regions that are particularly well excavated appear bright instead of dark. We might be able to improve that last problem by coloring each pixel according to its distance from either extreme, so that dark tunnels and bright backgrounds are set to ‘black’ and the medium brown dirt is set to ‘white’ - but that’s more involved, and we’ll return to that optimization later if necessary.
In broad strokes, we’ve set excavated space to black and dirt to white. If we aggregate over regions of the image, maybe we can compensate for the noise.
Hexagonal Lattices
My first thought was to overlay a square graph on the image. For each, say, 10x10 pixel region of the image, count the number of black pixels, and if they’re above a cutoff threshold then set the whole square to black, otherwise set it to white. This moves us from a messy image representation to a simpler tile representation, like a board game.
There are a few problems with this approach. Looking ahead, I want to identify rooms and tunnels based on clumps of adjacent black tiles. A square has only four neighbors - eight if we count diagonals, but diagonally-adjacent tiles don’t necessarily imply that the ants have dug a tunnel between the two spaces. So, we’ll use hexagons instead of squares: six-neighbors, no awkwardness about ‘corners,’ and we can still construct a regular lattice:

So far so good! A hexagonal coordinate system is a little different from a Cartesian grid, but fortunately I’ve worked with cube coordinates before. For simplicity, we’ll set the diameter of a hexagon to the diameter of a tunnel. This should help us distinguish between tunnels and rooms later on, because tunnels will be around one tile wide, while rooms will be much wider.
Unfortunately, a second problem still remains: there’s no good threshold for how many black pixels should be inside a hexagon before we set it to black. A hexagon smack in the middle of a tunnel should contain mostly black pixels. But what if the hexagons aren’t centered? In a worst-case scenario a tunnel will pass right between two hexagons, leaving them both with half as many black pixels. If we set the threshold too tight then we’ll set both tiles to white and lose a tunnel. If we set the threshold too loose then we’ll set both tiles to black and make a tunnel look twice as wide as is appropriate - perhaps conflating some tunnels with rooms.
So, I’m going to try dithering! This is a type of error propagation used in digital signal processing, typically in situations like converting color images to black and white. In our case, tiles close to white will still be set to white, and tiles close to black will still be darkened to black - but in an ambiguous case where two adjoining tiles are not-quite-dark-enough to be black, we’ll round one tile to white, and the other to black. The result is mostly okay:
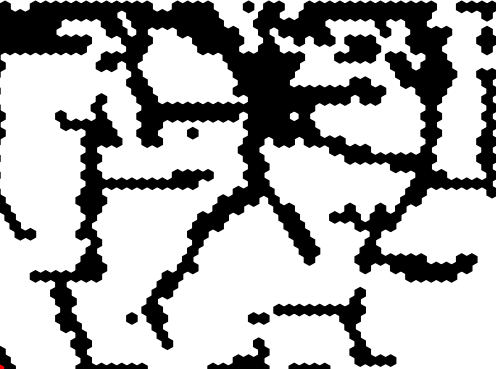
We’re missing some of the regions in the upper right that the ants excavated so completely that the white background shone through. We’re also missing about two hexagons needed to connect the rooms and tunnels on the center-left with the rest of the nest. We might be able to correct both these issues by coloring pixels according to contrast and more carefully calibrating the dithering process, but we’ll circle back to that later.
Flood Filling
So far we’ve reduced a messy color photograph to a much simpler black-and-white tile board, but we still need to identify rooms, junctions, and tunnels. I’m going to approach this with a depth first search:
-
Define a global set of explored tiles, and a local set of “neighborhood” tiles. Select an unexplored tile at random as a starting point.
-
Mark the current tile as explored, add it to the neighborhood, and make a list of unexplored neighbors
-
If the list is longer than three, recursively explore each neighbor starting at step 2
-
Once there are no more neighbors to explore, mark the neighborhood as a “room” if it contains at least ten tiles, and a “junction” if it contains at least four. Otherwise, the neighborhood is part of a tunnel, and should be discarded.
-
If any unexplored tiles remain, select one and go to step 2
Once all tiles have been explored, we have a list of “rooms” and a list of “junctions,” each of which are themselves lists of tiles. We can visualize this by painting the rooms blue and the junctions red:

Looking good so far!
Making a Graph
We’re most of the way to a graph representation. We need to create a ‘vertex’ for each room or junction, with a size proportional to the number of tiles in the room, and a position based on the ‘center’ of the tiles.
Then we need to add edges. For this we’ll return to a depth-first flood fill algorithm. This time, however, we’ll recursively explore all tiles adjacent to a room that aren’t part of another room or junction, to see which other vertices are reachable. This won’t preserve the shape, length, or width of a tunnel, but it will identify which areas of the nest are reachable from which others:
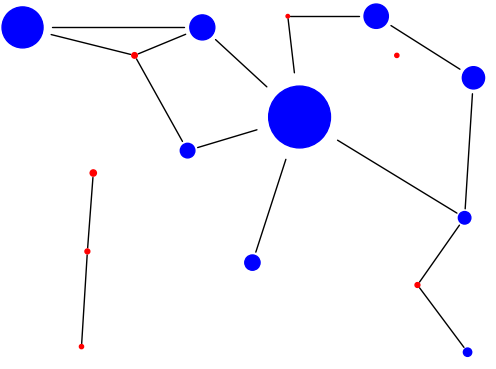
And there we have it!
Drawbacks, Limitations, Next Steps
We’ve gone from a color photo of an ant farm to a network diagram, all using simple algorithms, no fancy machine learning. I think we have a decent result for a clumsy first attempt!
There are many caveats. We’re missing some excavated spaces because of the wall color behind the ant farm in our sample photo. The dithering needs finer calibration to identify some of the smaller tunnels. Most importantly, an enormous number of details need to be calibrated for each ant farm photo. The brightness and contrast adjustments and noise reduction, the hexagon size, the dithering thresholds, and the room and junction sizes for flood filling, may all vary between each colony photo.
For all these reasons, I’m pausing here. If I think of a good way to auto-calibrate those parameters and improve on the image flattening and dithering steps, then maybe I’ll write a part two. Otherwise, this has progressed beyond a couple-evening toy project, so I’ll leave the code as-is.
Geolocating Users via Text Messages
Posted 7/28/2023
A recent research paper, Freaky Leaky SMS: Extracting User Locations by Analyzing SMS Timings (PDF), purports to geolocate phone numbers by texting them and analyzing response times. This is creepy, interesting, and hopefully a warning that can perhaps help phone companies to better protect their customers’ privacy in the future. Today I’m writing up a short summary, context, and some of my thoughts about the study. The original paper is intended for computer security and machine learning scientists, but I intend to write for a broader audience in this post.
The Concept
When Alice sends Bob a text message, Bob’s phone sends back an acknowledgement automatically - “I received your text!” If Alice’s phone doesn’t receive that acknowledgement before a timeout, Alice gets a “Failed to deliver text” error.
If Alice is standing next to Bob in Chicago, that text should be delivered quickly, and the acknowledgement should arrive almost instantly. If Alice is in Chicago and Bob is in Hong Kong, it should take slightly longer for the round-trip text message and acknowledgement.
So, if the delay before a text acknowledgement correlates with the distance between the phones, can we text Bob from three different phones, and by analyzing the delays, triangulate his position? What level of precision can we obtain when tracking Bob in this way?
The Limitations
In reality, text message delays will be messy. If Alice’s texts travel through a telecommunications hub in Chicago, then there may be a delay related to the amount of congestion on that hub. If there are multiple paths between Alice and Bob across telecommunications equipment, then each path may incur a different delay. Finally, the routes of telecommunications equipment may not take birds-eye-view shortest paths between locations. For example, if Alice and Bob are on opposite sides of a mountain range, the phone switches connecting them may divert around the mountains or through a pass, rather than directly over.
However, “messy” does not mean random or uncorrelated. If we text Bob enough times from enough phones, and apply some kind of noise reduction (maybe taking the median delay from each test-phone?), we may be able to overcome these barriers and roughly identify Bob’s location.
The Study
The researchers set up a controlled experiment: they select 34 locations across Europe, the United States, and the United Arab Emirates, and place a phone at each. They assign three of these locations as “senders” and all 34 as “receivers.”
To gather training data, they send around 155K text messages, in short bursts every hour over the course of three days. This provides a baseline of round-trip texting time from the three senders to the 34 receivers during every time of day (and therefore, hopefully, across a variety of network congestion levels).
For testing, the researchers can text a phone number from their three senders, compare the acknowledgement times to their training data, and predict which of the 34 locations a target phone is at. The researchers compare the test and training data using a ‘multilayer perceptron’, but the specific machine learning model isn’t critical here. I’m curious whether a much simpler method, like k-nearest-neighbors or a decision-tree, might perform adequately, but that’s a side tangent.
The heart of the research paper consists of two results, in sections 5.1 and 5.2. First, they try to distinguish whether a target is ‘domestic’ or ‘abroad.’ For example, the sensors in the UAE can tell whether a phone number is also at one of the locations in the UAE with 96% accuracy. This is analogous to our starting example of distinguishing between a Chicago-Chicago text and a Chicago-Hong-Kong text, and is relatively easy, but a good baseline. They try distinguishing ‘domestic’ and ‘abroad’ phones from a variety of locations, and retain high accuracy so long as the two countries are far apart. Accuracy drops to between 75 and 62% accuracy when both the sensor and target are in nearby European countries, where timing differences will be much smaller. Still better than random guessing, but no longer extremely reliable.
Next, the researchers pivot to distinguishing between multiple target locations in a single country - more challenging both because the response times will be much closer, and because they must now predict from among four or more options rather than a simple “domestic” and “abroad”. Accuracy varies between countries and the distances between target locations, but generally, the technique ranges between 63% and 98% accurate.
The rest of the paper has some auxiliary results, like how stable the classifier accuracy is over time as congestion patterns change, how different phones have slightly different SMS acknowledgement delays, and how well the classifier functions if the target individual travels between locations. There’s also some good discussion on the cause of errors in the classifier, and comparisons to other types of SMS attacks.
Discussion
These results are impressive, but it’s important to remember that they are distinguishing only between subsets of 34 predefined locations. This study is a far cry from “enter any phone number and get a latitude and longitude,” but clearly there’s a lot of signal in the SMS acknowledgement delay times.
So what can be done to fix this privacy leak? Unfortunately, I don’t see any easy answers. Phones must return SMS acknowledgements, or we’d never know if a text message was delivered successfully. Without acknowledgements, if someone’s phone battery dies, or they put it in airplane mode, or lose service while driving through a tunnel, text messages to them would disappear into the void.
Phones could add a random delay before sending an acknowledgement - or the telecommunications provider could add such a delay on their end. This seems appealing, but the delay would have to be short - wait too long to send an acknowledgement, and the other phones will time out and report that the text failed to deliver. If you add a short delay, chosen from, say, a uniform or normal distribution, then sending several texts and taking the median delay will ‘de-noise’ the acknowledgement time.
Right now there are two prominent “defenses” against this kind of attack. The first is that it’s a complicated mess to pull off. To generalize from the controlled test in the paper to finding the geolocation of any phone would require more ‘sending’ phones, lots more receiving phones for calibration, and a ton of training data, not to mention a data scientist to build a classifier around that data. The second is that the attack is “loud:” texting a target repeatedly to measure response times will bombard them with text messages. This doesn’t prevent the attack from functioning, but at least the victim receives some indication that something weird is happening to them. There is a type of diagnostic SMS ping called a silent SMS that does not notify the user, but these diagnostic messages can only be sent by a phone company, and are intended for things like confirming reception between a cell phone and tower.
Overall, a great paper on a disturbing topic. I often find side-channel timing attacks intriguing; the researchers haven’t identified a ‘bug’ exactly, the phone network is functioning exactly as intended, but this is a highly undesired consequence of acknowledgement messages, and a perhaps unavoidable information leak if we’re going to provide acknowledgement at all.
We don’t need ML, we have gzip!
Posted 7/15/2023
A recent excellent paper performs a sophisticated natural language processing task, usually solved using complicated deep-learning neural networks, using a shockingly simple algorithm and gzip. This post will contextualize and explain that paper for non-computer scientists, or for those who do not follow news in NLP and machine learning.
What is Text Classification?
Text Classification is a common task in natural language processing (NLP). Here’s an example setting:
Provided are several thousand example questions from Yahoo! Answers, pre-categorized into bins like ‘science questions,’ ‘health questions,’ and ‘history questions.’ Now, given an arbitrary new question from Yahoo! Answers, which category does it belong in?
This kind of categorization is easy for humans, and traditionally much more challenging for computers. NLP researchers have spent many years working on variations of this problem, and regularly host text classification competitions at NLP conferences. There are a few broad strategies to solving such a task.
Bag of Words Distance
One of the oldest computational tools for analyzing text is the Bag of Words model, which dates back to the 1950s. In this approach, we typically discard all punctuation and capitalization and common “stop words” like “the,” “a,” and “is” that convey only structural information. Then we count the number of unique words in a sample of text, and how many times each occur, then normalize by the total number of words.
For example, we may take the sentence “One Ring to rule them all, One Ring to find them, One Ring to bring them all, and in the darkness bind them” and reduce it to a bag of words:
{
    'one': 0.27,
    'ring': 0.27,
    'rule': 0.09,
    'find': 0.09,
    'bring': 0.09,
    'darkness': 0.09,
    'bind': 0.09
}
We could then take another passage of text, reduce it to a bag of words, and compare the bags to see how similar the word distributions are, or whether certain words have much more prominence in one bag than another. There are many tools for performing this kind of distribution comparison, and many ways of handling awkward edge cases like words that only appear in one bag.
The limitations of bags of words are obvious - we’re destroying all the context! Language is much more than just a list of words and how often they appear: the order of words, and their co-occurrence, conveys lots of information, and even structural elements like stop words and punctuation convey some information, or we wouldn’t use them. A bag of words distills language down to something that basic statistics can wrestle with, but in so doing boils away much of the humanity.
Word Embeddings
Natural Language Processing has moved away from bags of words in favor of word embeddings. The goal here is to capture exactly that context of word co-occurrence that a bag of words destroys. For a simple example, let’s start with Asimov’s laws of robotics:
A robot may not injure a human being or, through inaction, allow a human being to come to harm. A robot must obey orders given it by human beings except where such orders would conflict with the First Law. A robot must protect its own existence as long as such protection does not conflict with the First or Second Law
Removing punctuation and lower-casing all terms, we could construct a window of size two, encompassing the two words before and after each term as context:
| Term | Context |
|---|---|
| robot | a, may, not, harm, must, obey, law, protect |
| human | injure, a, being, or, allow, to, it, by, except |
| orders | must, obey, given, it, where, such, would, conflict |
| … | … |
This gives us a small amount of context for each term. For example, we know that “orders” are things that can be “obeyed,” “given,” and may “conflict.” You can imagine that if we used a larger corpus for training, such as the complete text of English Wikipedia, we would get a lot more context for each word, and a much better sense of how frequently words appear in conjunction with one another.
Now let’s think of each word as a point in space. The word “robot” should appear in space close to other words that it frequently appears near, such as “harm,” “obey,” and “protect,” and should appear far away from words it never co-occurs with, such as “watermelon.” Implicitly, this means that “robot” will also appear relatively close to other words that share the same context - for example, while “robot” does not share context with “orders,” both “orders” and “robot” share context with “obey,” so the words “robot” and “orders” will not be too distant.
This mathematical space, where words are points with distance determined by co-occurrence and shared context, is called an embedding. The exact process for creating this embedding, including how many dimensions the space should use, how much context should be included, how points are initially projected into space, how words are tokenized, whether punctuation is included, and many finer details, vary between models. For more details on the training process, I recommend this Word Embedding tutorial from Dave Touretzky.
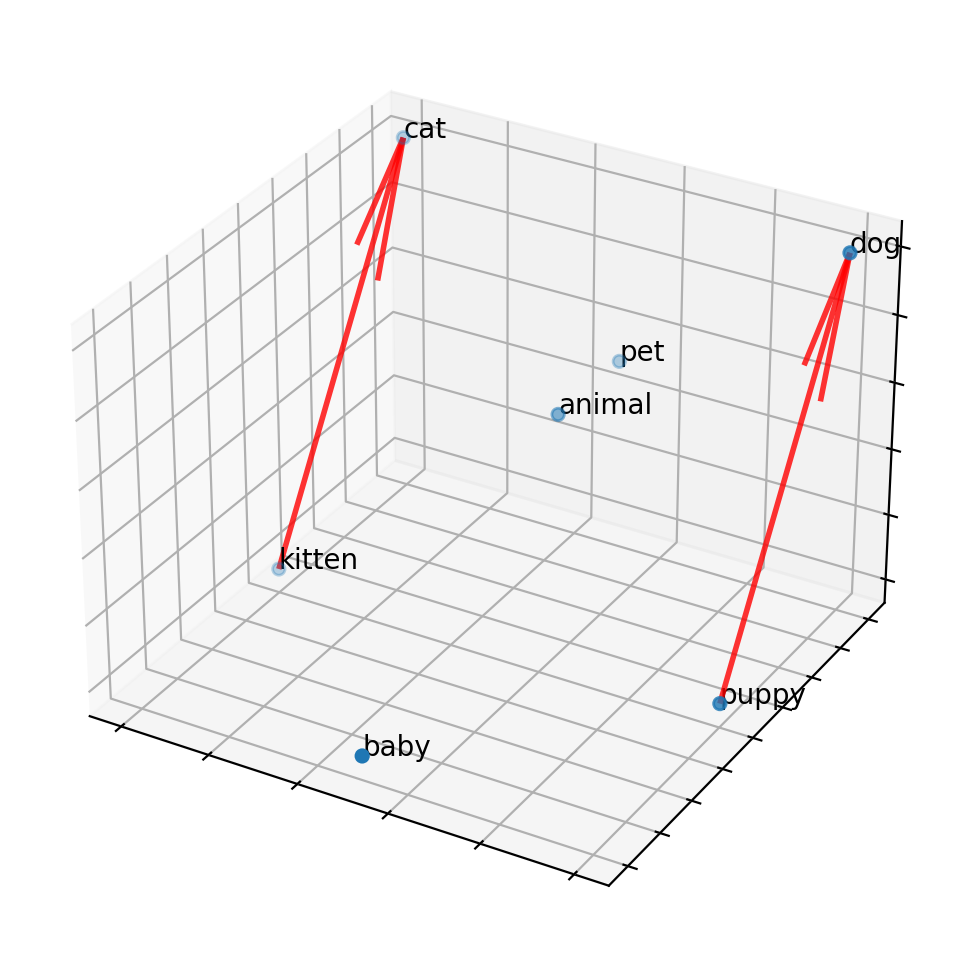
Once we have an embedding, we can ask a variety of questions, like word association: kitten is to cat as puppy is to X? Mathematically, we can draw a vector from kitten to cat, then transpose that vector to “puppy” and look for the closest point in the embedding to find “dog.” This works because “cat” and “dog” are in a similar region of the embedding, as they are both animals, and both pets. The words “kitten” and “puppy” will be close to their adult counterparts, and so also close to animal and pet associations, but will additionally be close to youth terms like “baby” and “infant”.
(Note that these embeddings can also contain undesired metadata: for example, “doctor” may be more closely associated with “man” than “woman”, and the inverse for “nurse”, if the training data used to create the embedding contains such a gender bias. Embeddings represent word adjacency and similar use in written text, and should not be mistaken for an understanding of language or a reflection of the true nature of the world.)
In addition to describing words as points in an embedding, we can now describe documents as a series of points, or as an average of those points. Given two documents, we can now calculate the average distance from points in one document to points in another document. Returning to the original problem of text classification, we can build categories of documents as clouds of points. For each new prompt, we can calculate its distance from each category, and place it in the closest category.
These embedding techniques allow us to build software that is impressively flexible: given an embedded representation of ‘context’ we can use vectors to categorize synonyms and associations, and build machines that appear to ‘understand’ and ‘reason’ about language much more than preceding Bag of Words models, simple approaches at representing context like Markov Chains, or attempts at formally parsing language and grammar. The trade-off is that these models are immensely complicated, and require enormous volumes of training data. Contemporary models like BERT have hundreds of millions of parameters, and can only be trained by corporations with vast resources like Google and IBM.
The State of the Art
In modern Natural Language Processing, deep neural networks using word embeddings dominate. They produce the best results in a wide variety of tasks, from text classification to translation to prediction. While variations between NLP models are significant, the general consensus is that more parameters and more training data increase performance. This focuses most of the field on enormous models built by a handful of corporations, and has turned attention away from simpler or more easily understood techniques.
Zhiying Jiang, Matthew Y.R. Yang, Mikhail Tsirlin, Raphael Tang, Yiqin Dai, and Jimmy Lin, did not use a deep neural network and a large embedding space. They did not use machine learning. They used gzip.
Their approach is simple: compression algorithms, like gzip, are very good at recognizing patterns and representing them succinctly. If two pieces of text are similar, such as sharing many words, or especially entire phrases, then compressing the two pieces of text together should be quite compact. If the two pieces of text have little in common, then their gzipped representation will be less compact.
Specifically, given texts A, B, and C, if A is more similar to B than C, then we can usually expect:
len(gzip(A+B)) - len(gzip(A)) < len(gzip(A+C)) - len(gzip(A))
So, given a series of pre-categorized texts in a training set, and given a series of uncategorized texts in a test set, the solution is clear: compress each test text along with each training text to find the ‘distance’ between the test text and each training text. Select the k nearest neighbors, and find the most common category among them. Report this category as the predicted category for the test text.
Their complete algorithm is a fourteen line Python script:
import gzip
import numpy as np
for (x1,_) in test_set:
    Cx1 = len(gzip.compress(x1.encode()))
    distance_from_x1 = []
    for (x2,_) in training_set:
        Cx2 = len(gzip.compress(x2.encode())
        x1x2 = " ".join([x1,x2])
        Cx1x2 = len(gzip.compress(x1x2.encode())
        ncd = (Cx1x2 - min(Cx1,Cx2)) / max (Cx1,Cx2)
        distance_from_x1.append(ncd)
    sorted_idx = np.argsort(np.array(distance_from_x1))
    top_k_class = training_set[sorted_idx[:k], 1]
    predict_class = max(set(top_k_class), key = top_k_class.count)
Shockingly, this performs on par with most modern NLP classifiers: it performs better than many for lots of common English classification data sets, and on most data sets it performs above average. BERT has higher accuracy on every data set, but not by much. A fourteen line Python script with gzip in lieu of machine learning performs almost as well as Google’s enormous embedded deep learning neural network. (See table 3 in the original paper, page 5)
A more recent variant on the classification challenge is to classify text in a language not included in the training data. For example, if we expended enormous resources training BERT on English text, is there any way to pivot that training and apply that knowledge to Swahili? Can we use embeddings from several languages to get some general cross-language fluency at text categorization in other languages? Or, if we do need to re-train, how little training data can we get away with to re-calibrate our embeddings and function on a new language? This is unsurprisingly a very difficult task. The gzip classifier outperformed all contemporary machine learning approaches that the authors compared to. (See table 5 in the original paper, page 6)
Conclusions
This paper is a great reminder that more complicated tools, like ever-larger machine-learning models, are not always better. In particular, I think their approach hits upon an interesting balance regarding complexity. Bag of words models discard context and punctuation, making computation simple, but at the cost of destroying invaluable information. However, keeping all of this information in the form of an embedding, and attempting to parse human language, incurs a heavy complexity cost. There’s a lot of “fluff” in language that we do not necessarily need for classification. The gzip approach keeps the extra context of word order and punctuation, but does not try to tackle the harder problem of understanding language in order to address the simpler problem of looking for similarities. In general, tools should be as simple as possible to complete their task, but no simpler.
EDIT 7/18/2023 - Misleading Scores in Paper
It appears that the authors have a made an unusual choice in their accuracy calculations, which inflate their scores compared to contemporary techniques. In summary, they use a kNN classifier with k=2, but rather than choosing a tie-breaking metric for when the two neighbors diverge, they mark their algorithm as correct if either neighbor has the correct label. This effectively makes their accuracy a “top 2” classifier rather than a kNN classifier, which misrepresents the performance of the algorithm. This isn’t necessarily an invalid way to measure accuracy, but it does need to be documented, and isn’t what we’d expect in traditional kNN. The gzip scores under a standard k=2 kNN remain impressive for such a simple approach and are still competitive - but they’re no longer beating deep neural network classifiers for non-English news datasets (table 5).
Here’s the problem in a little more detail:
-
The authors compress all training texts along with the test prompt, to find the gzip distance between the prompt and each possible category example
-
Rather than choosing the closest example and assuming the categories match, the authors choose the
kclosest examples, take the mode of their categories, and predict that. This k-nearest-neighbors (kNN) strategy is common in machine learning, and protects against outliers -
When the number of categories among neighbors are tied, one must have a tie-breaking strategy. A common choice is to pick the tie that is a closer neighbor. Another choice might be to expand the neighborhood, considering one additional neighbor until the tie is broken - or inversely, to shrink the neighborhood, using a smaller k until the tie is broken. Yet another choice might be to randomly choose one of the tied categories.
-
The authors use
k=2, meaning that they examine the two closest neighbors, which will either be of the same category, or will be a tie. Since they will encounter many ties, their choice of tie-breaking algorithm is very important -
In the event of a tie between two neighbors, the authors report success if either neighbor has the correct label
The code in question can be found here. Further analysis by someone attempting to reproduce the results of the paper can be found here and is discussed in this GitHub issue. In conversations with the author this appears to be an intentional choice - but unfortunately it’s one that makes the gzip classifier appear to outperform BERT, when in reality if it gives you two potentially correct classes and you always pick the correct choice you will outperform BERT.
I’ve heard the first author is defending their thesis tomorrow - Congratulations, good luck, hope it goes great!
Bloom Filters
Posted 4/8/2023
Sticking with a theme from my last post on HyperLogLog I’m writing about more probabilistic data structures! Today: Bloom Filters.
What are they?
Bloom filters track sets: you can add elements to the set, and you can ask “is this element in the set?” and you can estimate the size of the set. That’s it. So what’s the big deal? Most languages have a set in their standard library. You can build them with hash tables or trees pretty easily.
The magic is that Bloom filters can store a set in constant space, while traditional set data structures scale linearly with the elements they contain. You allocate some space when you create the Bloom filter - say, 8 kilobytes of cache space - and the Bloom filter will use exactly 8 kilobytes no matter how many elements you add to it or how large those elements are.
There are two glaring limitations:
-
You cannot enumerate a Bloom filter and ask what elements are in the set, you can only ask whether a specific element may be in the set
-
Bloom filters are probabilistic: they can tell you that an element is not in the set with certainty (no false negatives), but they can only tell you that an element may be in the set, with uncertainty
When creating a Bloom filter, you tune two knobs that adjust their computational complexity and storage requirements, which in turn control their accuracy and the maximum number of unique elements they can track.
Applications
Why would we want a non-deterministic set that can’t tell us definitively what elements it includes? Even if constant-space storage is impressive, what use is a probabilistic set?
Pre-Cache for Web Browsers
Your web-browser stores images, videos, CSS, and other web elements as you browse, so that if you navigate to multiple pages on a website that re-use elements, or you browse from one website to another and back again, it doesn’t need to re-download all those resources. However, spinning hard drives are slow, so checking an on-disk cache for every element of a website will add a significant delay, especially if we learn that we don’t have the element cached and then need to fetch it over the Internet anyway. One solution here is using a Bloom filter as a pre-cache: check whether the URL of a resource is in the Bloom filter, and if we get a “maybe” then we check the disk cache, but if we get a “no” then we definitely don’t have the asset cached and need to make a web request. Because the Bloom filter takes a small and fixed amount of space we can cache it in RAM, even if a webpage contains many thousands of assets.
Pre-Cache for Databases
Databases can use Bloom filters in a similar way. SQL databases are typically stored as binary trees (if indexed well) to faciliate fast lookup times in queries. However, if a table is large, and lots of data must be read from a spinning hard drive, then even a well-structured table can be slow to read through. If queries often return zero rows, then this is an expensive search for no data! We can use Bloom filters as a kind of LOSSY-compressed version of rows or columns in a table. Does a row containing the value the user is asking for exist in the table? If the Bloom filter returns “maybe” then evaluate the query. If the Bloom filter returns “no” then return an empty set immediately, without loading the table at all.
Tracking Novel Content
Social media sites may want to avoid recommending the same posts to users repeatedly in their timeline - but maintaining a list of every tweet that every user has ever seen would require an unreasonable amount of overhead. One possible solution is maintaining a Bloom filter for each user, which would use only a small and fixed amount of space and can identify posts that are definitely new to the user. False positives will lead to skipping some posts, but in an extremely high-volume setting this may be an acceptable tradeoff for guaranteeing novelty.
How do Bloom filters work?
Adding elements
Bloom filters consist of an array of m bits, initially all set to 0, and k hash functions (or a single function with k salts). To add an element to the set, you hash it with each hash function. You use each hash to choose a bucket from 0 to m-1, and set that bucket to 1. In psuedocode:
def add(element)
    for i in 0..k
        bin = hash(element, i) % m
        Bloomfilter[bin] = 1
As a visual example, consider a ten-bit Bloom filter with three hash functions. Here we add two elements:
Querying the Bloom filter
Querying the Bloom filter is similar to adding elements. We hash our element k times, check the corresponding bits of the filter, and if any of the bits are zero then the element does not exist in the set.
def isMaybePresent(element)
    for i in 0..k
        bin = hash(element, i) % m
        if( Bloomfilter[bin] == 0 )
            return false
    return true
For example, if we query ‘salmon’, we find that one of the corresponding bits is set, but the other two are not. Therefore, we are certain that ‘salmon’ has not been added to the Bloom filter:
If all of the corresponding bits are one then the element might exist in the set, or those bits could be the result of a full- or several partial-collisions with the hashes of other elements. For example, here’s the same search for ‘bowfin’:
While ‘bowfin’ hasn’t been added to the Bloom filter, and neither of the added fish have a complete hash collision, the partial hash collisions with ‘swordfish’ and ‘sunfish’ cover the same bits as ‘bowfin’. Therefore, we cannot be certain that ‘bowfin’ has or has not been added to the filter.
Estimating the Set Length
There are two ways to estimate the number of elements in the set. One is to maintain a counter: every time we add a new element to the set, if those bits were not all already set, then we’ve definitely added a new item. If all the bits were set, then we can’t distinguish between adding a duplicate element and an element with hash collisions.
Alternatively, we can retroactively estimate the number of elements based on the density of 1-bits, the number of total bits, and the number of hash functions used, as follows:
In other words, the density of 1-bits should correlate with the number of elements added, where we add k or less (in the case of collision) bits with each element.
Both estimates will begin to undercount the number of elements as the Bloom filter “fills.” Once many bits are set to one, hash collisions will be increasingly common, and adding more elements will have little to no effect on the number of one-bits in the filter.
Configurability
Increasing the number of hash functions lowers the chance of a complete collision. For example, switching from two hash functions to four means you need twice as many bits to be incidentally set by other elements of the set before a query returns a false positive. While I won’t include the full derivation, the optimal number of hash functions is mathematically determined by the desired false-positive collision rate (one in a hundred, one in a thousand, etc):
However, increasing the number of hash functions also fills the bits of the Bloom filter more quickly, decreasing the total number of elements that can be stored. We can compensate by storing more bits in the Bloom filter, but this increases memory usage. Therefore, the optimal number of bits in a Bloom filter will also be based on the false-positive rate, and on the number of unique elements we expect to store, which will determine how “full” the filter bits will be.
If we want to store more elements without increasing the error rate, then we need more bits to avoid further collisions. If we want to insert the same number of elements and a lower error-rate, then we need more bits to lower the number of collisions. If we deviate from this math by using too few bits or too many hash functions then we’ll quickly fill the filter and our error rate will skyrocket. If we use fewer hash functions then we’ll increase the error-rate through sensitivity to collisions, unless we also increase the number of bits, which can lower the error-rate at the cost of using more memory than necessary.
Note that this math isn’t quite right - we need an integer number of hash functions, and an integer number of bits, so we’ll round both to land close to the optimal configuration.
How well does this work in practice?
Let’s double-check the theoretical math with some simulations. I’ve inserted between one and five-thousand elements, and used the above equations to solve for optimal Bloom filter parameters for a desired error rate of 1%, 5%, and 10%.
Here’s the observed error rate, and the number of recommended hash functions, plotted using the mean result and a 95% confidence-interal:
As we can see, our results are almost spot-on, and become more reliable as the Bloom filter increases in size! Here are the same simulation results, where the hue represents the number of bits used rather than the number of hash functions:
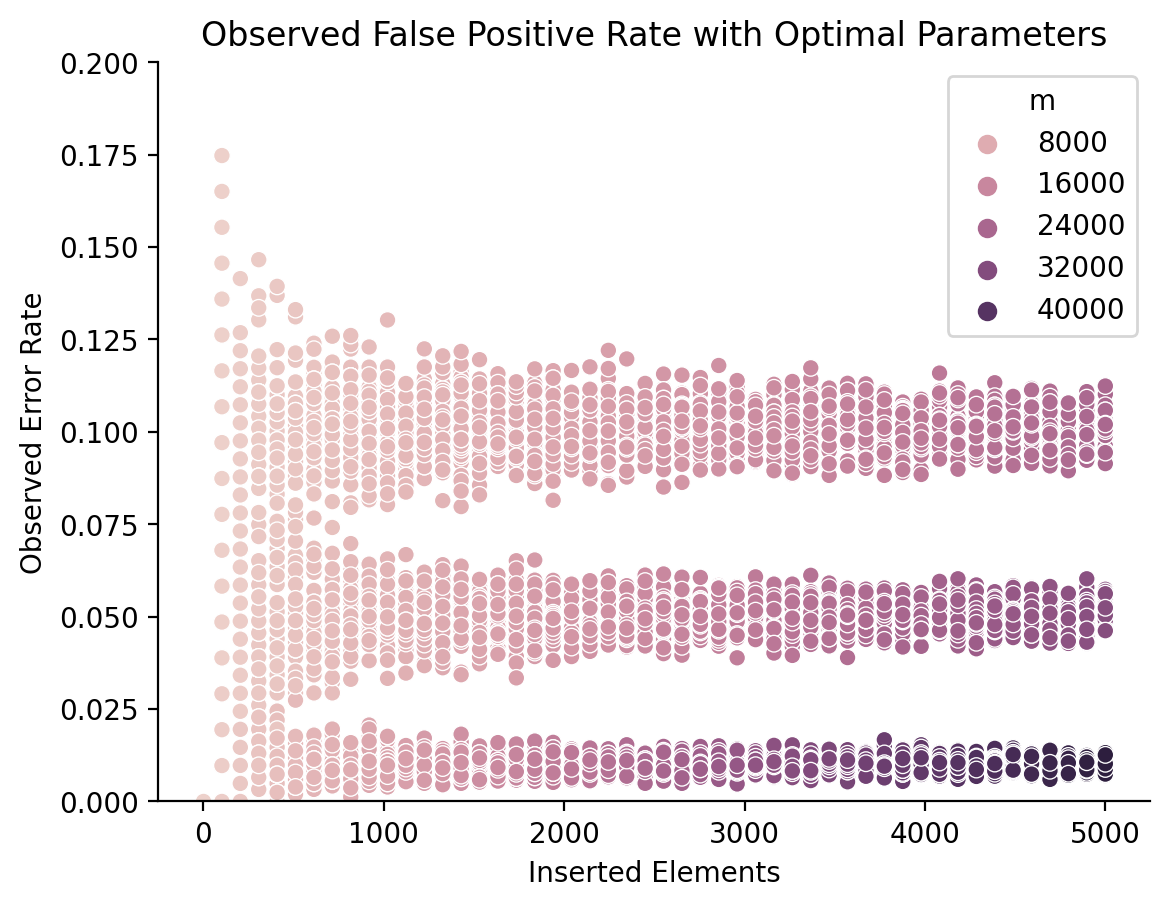
Since the number of recommended bits changes with the number of inserted elements, I had to plot this as a scatter plot rather than a line plot. We can see that the number of bits needed steadily increases with the number of inserted elements, but especially with the error rate. While storing 5000 elements with a 5% error rate requires around 24-kilobits, maintaining a 1% error rate requires over 40 kilobits (5 kilobytes).
Put shortly, the math checks out.
Closing Thoughts
I think I’m drawn to these probabilistic data structures because they loosen a constraint that I didn’t realize existed to do the “impossible.”
Computer scientists often discuss a trade-off between time and space. Some algorithms and data structures use a large workspace to speed computation, while others can fit in a small amount of space at the expense of more computation.
For example, inserting elements into a sorted array runs in O(n) - it’s quick to find the right spot for the new element, but it takes a long time to scoot all the other elements over to make room. By contrast, a hash table can insert new elements in (amortized) O(1), meaning its performance scales much better. However, the array uses exactly as much memory as necessary to fit all its constituent elements, while the hash table must use several more times memory - and keep most of it empty - to avoid hash collisions. Similarly, compression algorithms pack data into more compact formats, but require additional computation to get useful results back out.
However, if we loosen accuracy and determinism, creating data structures like Bloom filters that can only answer set membership with a known degree of confidence, or algorithms like Hyperloglog that can count elements with some error, then we can create solutions that are both time and space efficient. Not just space efficient, but preposterously so: constant-space solutions to set membership and size seem fundamentally impossible. This trade-off in accuracy challenges my preconceptions about what kind of computation is possible, and that’s mind-blowingly cool.
HyperLogLog: Counting Without Counters
Posted 3/20/2023
I recently learned about HyperLogLog, which feels like cursed counter-intuitive magic, so I am eager to share.
The Task
We want to count unique items, like “how many unique words appear across all books at your local library?” or “how many unique Facebook users logged in over the past month?” For a small set of unique tokens, like counting the unique words in this blog post, you might store each word in a set or hash table as you read them, then count the length of your set when you’re done. This is simple, but means the amount of memory used will scale linearly with the number of unique tokens, making such an approach impractical when counting enormous sets of tokens. But what if I told you we could accurately estimate the number of unique words while storing only a single integer?
Probabilistic Counting Algorithm
To start with, we want to hash each of our words. A hash function takes arbitrary data and translates it to a ‘random’ but consistent number. For example, we’ll use a hash function that takes any word and turns it into a number from zero to 2**64, with a uniform probability across all possible numbers. A good hash function will be unpredictable, so changing a single letter in the word or swapping the order of letters will yield a completely different number.
Next, we take the resulting hash, treat it as binary, and count how many leading bits are zero. An example is shown below:
We repeat this process for every word, tracking only the highest number of leading zero-bits we’ve observed, which we’ll call n. When we reach the end of our data, we return 2**n as our estimate of how many unique words we’ve seen.
Probabilistic Counting Theory
So how in the world does this work? The key is that a good hash function returns hashes uniformly across its range, so we have turned each unique word into random numbers. Since hashing functions are deterministic, duplicate words will return the same hash.
A uniformly random number of fixed bit-length (for example, a random 64-bit integer) will start with a zero-bit with a probability of 1/2, and will start with a 1-bit with a probability of 1/2. It will start with two zero-bits with a probability of 1/4, three zero-bits with a probability of 1/8, and so on. A probability tree for this might look like:
We can run this explanation in reverse: if you have observed a hash that starts with three zero-bits, then on average you will have observed about 8 unique hashes, because around 1 in 8 hashes start with three zero-bits.
This sounds great, but there are two problems. First, the words “on average” are pretty important here: if you only examine one word, and it happens to have a hash starting with four leading zeros, then our probabilistic counting algorithm will guess that you’ve examined sixteen words, rather than one. Over 6% of hashes will start with four leading zeros, so this is easily possible. We need some way to overcome these ‘outliers’ and get a more statistically representative count of leading zeros.
Second, our probabilistic counting function can only return integer powers of two as estimates. It can guess that you’ve observed 8, 256, or 1024 words, but it can never estimate that you’ve observed 800 words. We want an estimator with a higher precision.
Outlier Compensation and Precision Boosting: Multiple Hashes
One strategy for addressing both limitations of probabilistic counting is to use multiple hashes. If we hash each observed word using ten different hash functions (or one hash function with ten different salts, but that’s a technical tangent), then we can maintain ten different counts of the highest number of leading zeros observed. Then at the end, we return the average of the ten estimates.
The more hash functions we use, the less sensitive our algorithm will be to outliers. Additionally, averaging over multiple counts lets us produce non-integer estimates. For example, if half our hash functions yield a maximum of four leading zeros, and half yield a maximum of five leading zeros, then we could estimate 2**4.5 unique tokens, or around 23.
This approach solves both our problems, but at a severe cost: now we need to calculate ten times as many hashes! If we’re counting upwards of billions of words, then this approach requires calculating nine billion additional hashes. Clearly, this won’t scale well.
Outlier Compensation and Precision Boosting: HyperLogLog
Fortunately, there is an alternative solution that requires no additional hashing, known as HyperLogLog. Instead of using multiple hash functions and averaging across the results, we can instead pre-divide our words into buckets, and average across those.
For example, we could make 16 buckets, assign incoming hashes to each bucket uniformly, and maintain a “most leading zero-bits observed” counter for each bucket. Then we calculate an estimated number of unique elements from each bucket, and average across all buckets to get a global estimate.
For an easy approach to assigning hashes to each bucket, we can use the first four bits of each hash as a bucket ID, then count the number of leading zeros after this ID.
Once again, averaging across several sets of “most leading zeros” will minimize the impact of outliers, and afford us greater precision, by allowing non-integer exponents for our powers of two. Unlike the multiple hash solution, however, this approach will scale nicely.
One downside to HyperLogLog is that the bucket-averaging process is a little complicated. Dividing hashes across multiple buckets diminishes the impact of outliers, as desired, but it also diminishes the impact of all our hashes. For example, say we have 64 hashes, spread across 16 buckets, so 4 hashes per bucket. With 64 hashes, we can expect, on average, one hash with six leading zeros. However, each bucket has only four hashes, and therefore an expected maximum of two leading zeros. So while one bucket probably has six, most have closer to two, and taking the arithmetic mean of the buckets would severely underestimate the number of unique hashes we’ve observed. Therefore, HyperLogLog has a more convoluted estimation algorithm, consisting of creating estimates from each bucket, taking their harmonic mean, multiplying by the number of buckets squared, and multiplying by a magic number derived from the number of buckets1. This results in dampening outliers while boosting the estimate back into the appropriate range.
How well does it work in practice?
Here’s a plot comparing the accuracy of Probabilistic counting (count leading zeros, no compensation for outliers), Probabilistic-Med counting (run Probabilistic using ten hash functions, return median of results), and HyperLogLog (our fancy bucket solution):
I’ve generated random strings as input, and evaluate at 50 points on the x-axis, with 100 draws of random strings per x-axis point to create a distribution and error bars. The y-axis represents each estimation function’s guess as to the number of unique elements, with a 95% confidence interval.
Unsprisingly, plain probabilistic counting does not fare well. When we generate thousands of strings, the likelihood that at least one will have many leading zeros is enormous, and since our algorithm relies on counting the maximum observed leading zeros, it’s extremely outlier sensitive.
Taking the mean across ten hash algorithms is also outlier-sensitive when the outliers are large enough, which is why I’ve opted for the median in this plot. Probabilistic-Med performs much better, but it suffers the same problems over a larger time-scale: as we read more and more unique tokens, the likelihood goes up that all ten hash functions will see at least one hash with many leading zeros. Therefore, as the number of unique tokens increases, Probabilistic-Med steadily begins to over-estimate the number of unique tokens, with increasing error bars.
HyperLogLog reigns supreme. While error increases with the number of unique hashes, it remains more accurate, with tighter error bars, than the multi-hash strategy, while remaining computationally cheap. We can increase HyperLogLog’s error tolerance and accuracy in high-unique-token scenarios by increasing the number of buckets, although this lowers accuracy when the number of unique tokens is small.
Closing Thoughts
This is so darn cool! Tracking the total number of unique elements without keeping a list of those elements seems impossible - and it is if you need absolute precision - but with some clever statistics we can get a shockingly close estimate.
If you’d like to see a working example, here’s the code I wrote for generating the accuracy plot, which includes implementations of Probabilistic counting, Probabilistic-Med, and HyperLogLog. This is toy code in Python that converts all the hashes to strings of one and zero characters for easy manipulation, so it is not efficient and shouldn’t be treated as anything like an ideal reference.
If you enjoyed this post, you may enjoy my other writing on dimensional analysis, network science for social modeling, or algorithmic complexity.
Footnotes
-
The derivation of this number is quite complex, so in practice it’s drawn from a lookup table or estimated ↩
Algorithmic Complexity
Posted 3/6/2023
This is a post about Big-O notation and measuring algorithmic complexity; topics usually taught to computer science undergraduates in their second to fourth semester. It’s intended for curious people outside the field, or new students. There are many posts on this subject, but this one is mine.
In computer science we often care about whether an algorithm is an efficient solution to a problem, or whether one algorithm is more efficient than another approach. One might be tempted to measure efficiency in terms of microseconds it takes a process to run, or perhaps number of assembly instructions needed. However, these metrics will vary widely depending on what language an algorithm is implemented in, what hardware it’s run on, what other software is running on the system competing for resources, and a host of other factors. We’d prefer to think more abstractly, and compare one strategy to another rather than their implementations. In particular, computer scientists often examine how an algorithm scales, or how quickly it slows down as inputs grow very large.
The Basics
Let’s start with a trivial example: given a list of numbers, return their sum. Looks something like:
def sum(list):
    total = 0
    for item in list
        total += item
    end
    return total
end
Since we need to read the entire list, this algorithm scales linearly with the length of the list - make the list a hundred times longer, and it will take roughly a hundred times longer to get a sum. We write this formally as O(n), meaning “scales linearly with n, the size of the input.” We call this formal syntax “Big O notation,” where the ‘O’ stands for “order of approximation” (or in the original German, “Ordnung”).
Not all algorithms scale. If we were asked “return the third element in the list” then it wouldn’t matter whether the list is three elements long or three million elements long, we can get to the third element in a constant amount of time. This is written as O(1), indicating no reliance on the input size.
Search algorithms give us our first example problem with divergent solutions. Given a stack of papers with names on them, tell me whether “Rohan” is in the stack. A trivial solution might look like:
def hasName(list)
    for name in list
        if name == "Rohan"
            return true
        end
    end
    return false
end
This scales linearly with the length of the list, just like summing the elements. If the list is in an unknown order then we have no choice but to examine every element. However, if we know the list is in alphabetical order then we can do better. Start in the middle of the list - if the name is Rohan, we’re done. If we’re after Rohan alphabetically, then discard the second half of the list, and repeat on the first half. If we’re before Rohan alphabetically, then discard the first half of the list and repeat on the second. If we exhaust the list, then Rohan’s not in it. This approach is called a binary search, and visually looks like:
In code, a binary search looks something like:
def hasName(list)
    if( list.length == 0 )
        return false
    end
    middle = list.length / 2
    if( list[middle] == "Rohan" )
        return true
    elsif( list[middle] > "Rohan" )
        # Search left half
        return hasName(list.first(middle))
    else
        # Search right half
        return hasName(list[middle .. list.length]
    end
end
With every step in the algorithm we discard half the list, so we look at far fewer than all the elements. Our binary search still gets slower as the input list grows longer - if we double the length of the list we need one extra search step - so the algorithm scales logarithmically rather than linearly, denoted O(log n).
We’ll end this section by looking at two sorting algorithms: insertion sort, and merge sort.
Insertion Sort
We want to sort a list, provided to us in random order. One simple approach is to build a new sorted list: one at a time, we take elements from the front of the main list, and find their correct position among the sorted list we’ve built so far. To find the correct position we just look at the value left of our new element, and check whether they should be swapped or not. Keep swapping left until the new element finds its correct position. This visually looks like:
One implementation might look like:
def insertionSort(list)
    for i in 0.upto(list.length-1)
        for j in (i-1).downto(0)
            if( list[j] > list[j+1] )
                list[j], list[j+1] = list[j+1], list[j]
            else
                break # Done swapping, found the right spot!
            end
        end
    end
    return list
end
Insertion sort is simple and easy to implement. If you were coming up with a sorting algorithm on the spot for something like sorting a deck of cards, you might invent something similar. So what’s the runtime?
In insertion sort, we walk the list from start to end, which is O(n). For every new element we examine, however, we walk the list backwards from our current position to the start. This operation also scales linearly with the length of the list, and so is also O(n). If we perform a backwards O(n) walk for every step of the forwards O(n) walk, that’s O(n) * O(n) for a total of O(n^2). Can we do better?
Merge Sort
An alternative approach to sorting is to think of it as a divide-and-conquer problem. Split the list in half, and hand the first half to one underling and the second half to another underling, and instruct them each to sort their lists. Each underling does the same, splitting their lists in half and handing them to two further underlings. Eventually, an underling receives a list of length one, which is by definition already sorted. This splitting stage looks something like:
Now we want to merge our results upwards. Each underling hands their sorted list back up to their superiors, who now have two sorted sub-lists. The superior combines the two sorted lists by first making a new empty “merged” list that’s twice as long. For every position in the merged list, the superior compares the top element of each sorted sub-list, and moves the lower element to the merged list. This process looks like:
Once all elements from the two sub-lists have been combined into a merged list, the superior hands their newly sorted list upwards to their superior. We continue this process until we reach the top of the tree, at which point our work is done. This merge step looks like:
In code, the full algorithm might look something like:
# Combine two sorted lists
def merge(left, right)
    merged = []
    while( left.length + right.length > 0 )
        if( left.length == 0 )       # Left empty, take from right
            merged += right.shift(1)
        elsif( right.length == 0 )   # Right empty, take from left
            merged += left.shift(1)
        elsif( left[0] < right[0] )  # Top of left stack is less, take it
            merged += left.shift(1)
        else                         # Top of right stack is less, take it
            merged += right.shift(1)
        end
    end
    return merged
end

# Takes a single list, sub-divides it, sorts results
def mergeSort(list)
    if( list.length <= 1 )
        return list # Sorted already :)
    end
    middle = list.length / 2
    left = list[0 .. middle-1]
    right = list[middle .. list.length-1]
    leftSorted = mergeSort(left)
    rightSorted = mergeSort(right)
    return merge(leftSorted, rightSorted)
end
So what’s the runtime of merge sort? Well it takes log n steps to divide the list in half down to one element. We do this division process for every element in the list. That gives us a runtime of n * log n to break the list apart and create the full tree diagram.
Merging two sorted lists together scales linearly with the size of the lists, so the merge step is O(n). We need to perform a merge each time we move up a “level” of the tree, and there are log n levels to this tree. Therefore, the full merge process also scales with O(n log n).
This gives us a total runtime of O(n log n + n log n) or O(2n log n) to create the tree and merge it back together. However, because we are concerned with how algorithms scale as the inputs become very large, we drop constants and all expressions but the dominant term - multiplying by 2 doesn’t mean much as n approaches infinity - and simplify the run time to O(n log n). That’s a lot better than insertion sort’s O(n^2)!
Limitations of Big-O notation
Big O notation typically describes an “average” or “expected” performance and not a “best case” or “worst-case”. For example, if a list is in a thoroughly random order, then insertion sort will have a performance of O(n^2). However, if the list is already sorted, or only one or two elements are out of place, then insertion sort’s best-case performance is O(n). That is, insertion sort will walk the list forwards, and if no elements are out of place, there will be no need to walk the list backwards to find a new position for any elements. By contrast, merge sort will always split the list into a tree and merge the branches back together, so even when handed a completely sorted list, merge sort’s best-case performance is still O(n log n).
Big O notation also does not describe memory complexity. The description of merge sort above creates a temporary merged list during the merge step, meaning however long the input list is, merge sort needs at least twice as much memory space for its overhead. By contrast, insertion sort works “in place,” sorting the input list without creating a second list as a workspace. Many algorithms make a trade-off between time and space in this way.
Finally, Big O notation describes how an algorithm scales as n gets very large. For small values of n, insertion sort may outperform merge sort, because merge sort has some extra bookkeeping to allocate temporary space for merging and coordinate which minions are sorting which parts of the list.
In summary, Big O notation is a valuable tool for quickly comparing two algorithms, and can provide programmers with easy estimates as to which parts of a problem will be the most time-consuming. However, Big O notation is not the only metric that matters, and should not be treated as such.
Problem Complexity: A Birds-eye View
All of the algorithms described above can be run in polynomial time. This means their scaling rate, or Big O value, can be upper-bounded by a polynomial of the form O(n^k). For example, while merge sort scales with O(n log n), and logarithms are not polynomials, n log n is strictly less than n^2, so merge sort is considered to run in polynomial time. By contrast, algorithms with runtimes like O(2^n) or O(n!) are not bounded by a polynomial, and perform abysmally slowly as n grows large.
These definitions allow us to describe categories of algorithms. We describe algorithms that run in polynomial time as part of set P, and we typically describe P as a subset of NP - the algorithms where we can verify whether a solution is correct in polynomial time.
To illustrate the difference between running and verifying an algorithm, consider the graph coloring problem: given a particular map, and a set of three or more colors, can you color all the countries so that no two bordering countries have the same color? The known algorithms for this problem are tedious. Brute forcing all possible colorings scales with O(k^n) for k-colors and n-countries, and the fastest known general algorithms run in O(n * 2^n). However, given a colored-in map, it’s easy to look at each country and its neighbors and verify that none violate the coloring rules. At worst, verifying takes O(n^2) time if all countries border most others, but more realistically O(n) if we assume that each country only borders a small number of neighbors rather than a significant fraction of all countries.
Next, we have NP-Hard: these are the set of problems at least as hard as the most computationally intensive NP problems, but maybe harder - some NP-Hard problems cannot even have their solutions verified in polynomial time. When we describe a problem as NP-Hard we are often referring to this last property, even though the most challenging NP problems are also NP-Hard.
One example of an NP-Hard problem without polynomial verification is the Traveling Salesman: given a list of cities and distances between cities, find the shortest path that travels through every city exactly once, ending with a return to the original city. Trying all paths through cities scales with O(n!). More clever dynamic programming solutions improve this to O(n^2 2^n). But if someone claims to have run a traveling salesman algorithm, and hands you a path, how do you know it’s the shortest possible path? The only way to be certain is to solve the traveling salesman problem yourself, and determine whether your solution has the same length as the provided answer.
Finally, we have NP-Complete. These are the most challenging problems in NP, meaning:
-
Solutions to these algorithms can be verified in polynomial time
-
There is no known polynomial-time solution to these algorithms
-
Any problem in NP can be translated into an input to an NP-Complete problem in polynomial time, and the result of the NP-Complete algorithm can be translated back, again in polynomial time
Here’s a visualization of these problem classes:
Does P = NP?
Broad consensus in computer science is that the NP problem space is larger than the P problem space. That is, there are some problems that cannot be solved in polynomial time, but can be verified in polynomial time. However, no one has been able to definitively prove this, in large part because making formal arguments about such abstract questions is exceedingly difficult. There are many problems we do not know how to solve in polynomial time, but how do we prove there isn’t a faster, more clever solution that we haven’t thought of?
Therefore, a minority of computer scientists hold that P = NP, or in other words, all problems that can be verified in polynomial time can also be solved in polynomial time. This would make our set of problem classes look more like:
To prove that P equals NP, all someone would need to do is find a polynomial-time solution to any NP-Complete problem. Since we know all NP problems can be translated back and forth to NP-Complete problems in polynomial time, a fast solution to any of these most challenging problems would be a fast solution to every poly-verifiable algorithm. No such solution has been found.
Hex Grids and Cube Coordinates
Posted 2/10/2023
I recently needed to make a graph with a hex lattice shape, like this:
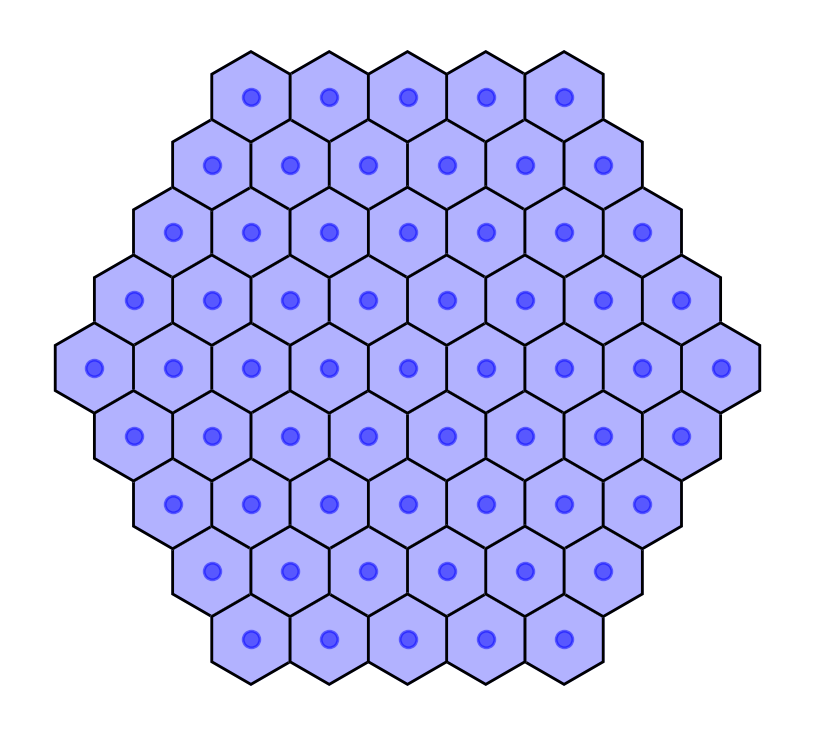
I needed to find distances and paths between different hexagonal tiles, which proved challenging in a cartesian coordinate system. I tried a few solutions, and it was a fun process, so let’s examine each option.
Row and Column (Offset) Coordinates
The most “obvious” way to index hexagonal tiles is to label each according to their row and column, like:
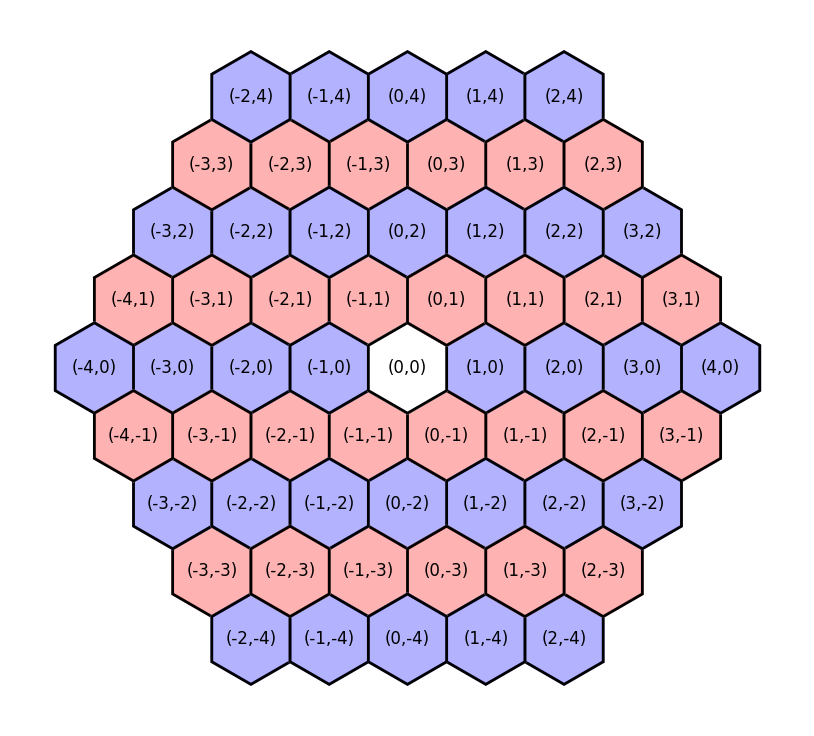
This feels familiar if we’re used to a rectangular grid and cartesian coordinate system. It also allows us to use integer coordinates. However, it has a few severe disadvantages:
-
Moving in the y-axis implies moving in the x-axis. For example, moving from (0,0) to (0,1) sounds like we’re only moving vertically, but additionally shifts us to the right!
-
Coordinates are not mirrored. Northwest of (0,0) is (-1,1), so we might expect that Southeast of (0,0) would be flipped across the vertical and horizontal, yielding (1,-1). But this is not the case! Southeast of (0,0) is (0,-1) instead, because by dropping two rows we’ve implicitly moved twice to the right already (see point one)
These issues make navigation challenging, because the offsets of neighboring tiles depend on the row. Southeast of (0,0) is (0,-1), but Southeast of (0,1) is (1,0), so the same relative direction sometimes requires changing the column, and sometimes does not.
Cartesian Coordinates
Rather than using row and column coordinates we could re-index each tile by its “true” cartesian coordinates:
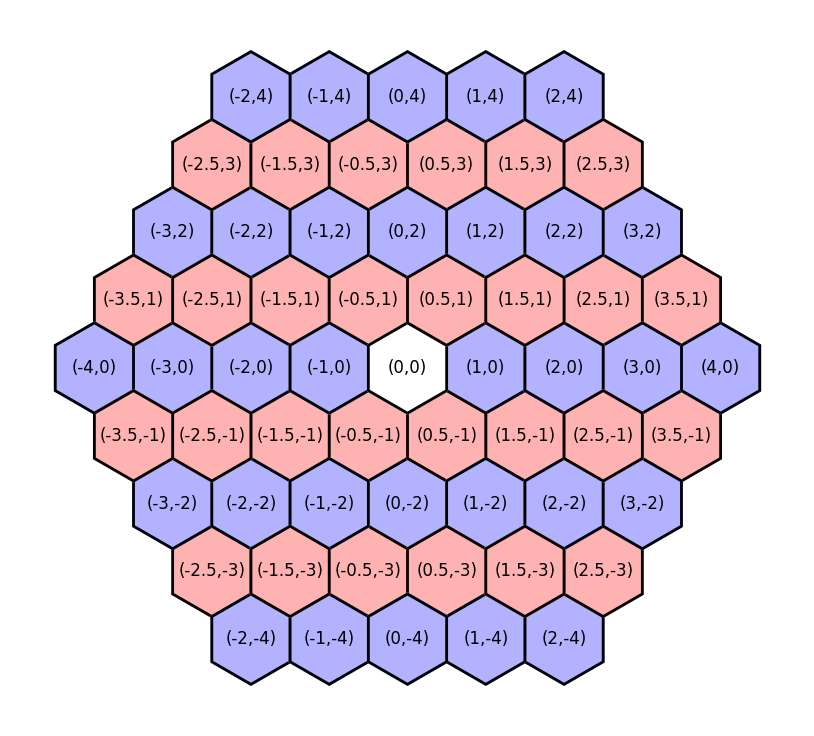
This makes the unintuitive aspects of offset coordinates intuitive:
-
It is now obvious that moving from (0,0) to (0.5,1) implies both a vertical and horizontal change
-
Coordinates now mirror nicely: Northwest of (0,0) is (-0.5,1), and Southeast of (0,0) is (0.5,-1).
-
Following from point 1, it’s now clear why the distance between (0,0) and (3,0) isn’t equal to the distance between (0,0) and (0.5,3).
But while cartesian coordinates are more “intuitive” than offset coordinates, they have a range of downsides:
-
We no longer have integer coordinates. We could compensate by doubling all the coordinates, but then (0,0) is adjacent to (2,0), and keeping a distance of one between adjacent tiles would be ideal.
-
While euclidean-distances are easy to calculate in cartesian space, it’s still difficult to calculate tile-distances using these indices. For example, if we want to find all tiles within two “steps” of (0,0) we need to use a maximum range of about 2.237, or the distance to (1,2).
Cube Coordinates
Fortunately there is a third indexing scheme, with integer coordinates, coordinate mirroring, and easy distance calculations in terms of steps! It just requires thinking in three dimensions!
In a cartesian coordinate system we use two axes, since we can move up/down, and left/right. However, on a hexagonal grid, we have three degrees of freedom: we can move West/East, Northwest/Southeast, and Northeast/Southwest. We can define the coordinate of each tile in terms of the distance along each of these three directions, like so:
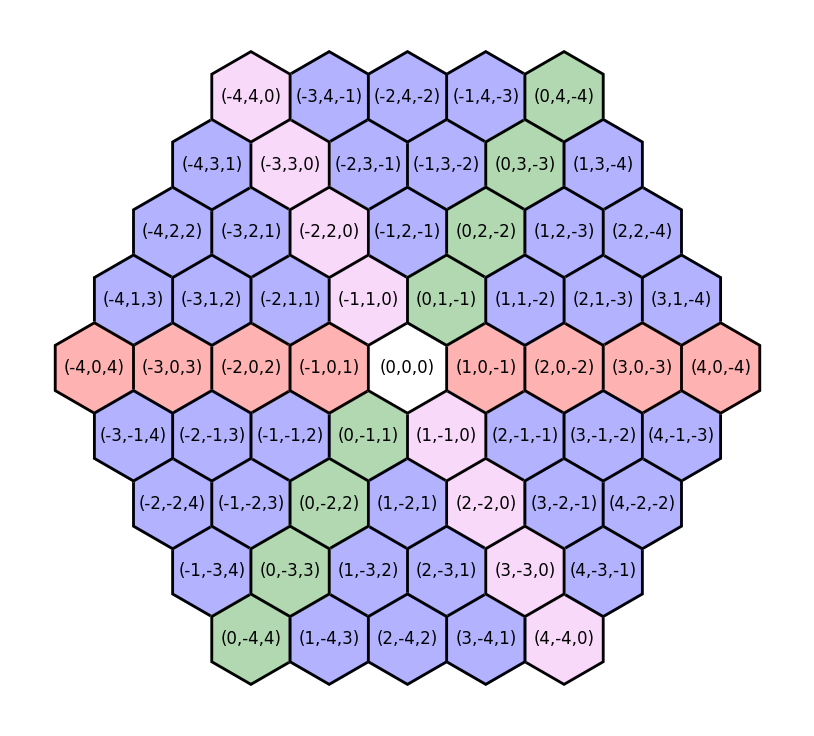
Why aren’t the cube coordinates simpler?
These “cube coordinates” have one special constraint: the sum of the coordinates is always zero. This allows us to maintain a canonical coordinate for each tile.
To understand why this is necessary, imagine a system where the three coordinates (typically referred to as (q,r,s) to distinguish between systems when we are converting to or from an (x,y) system) correspond directly with the three axes: q refers to distance West/East, r to Northwest/Southeast, and s to Northeast/Southwest. Here’s a visualization of such a scheme:
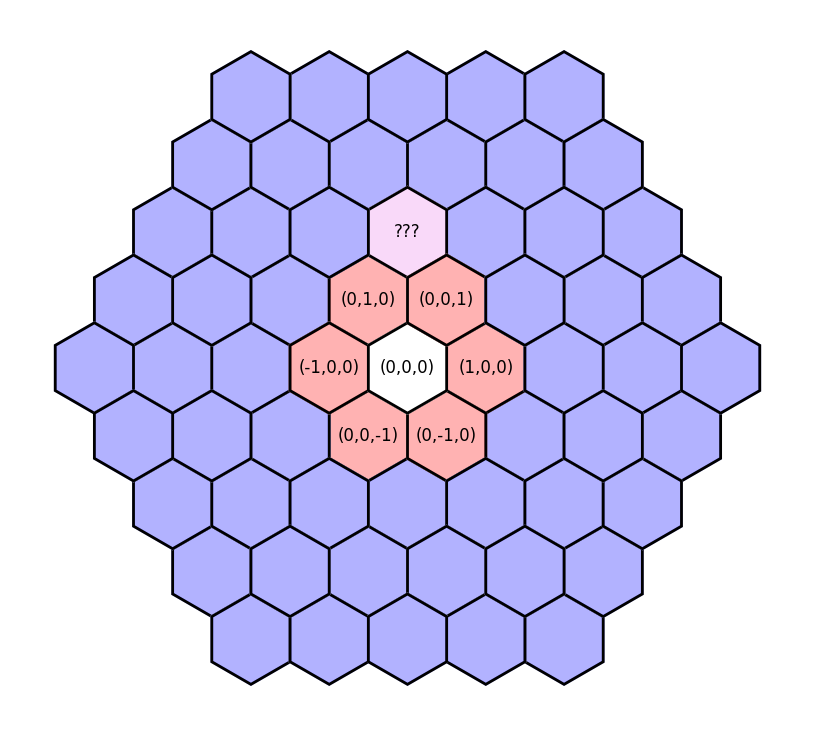
We could take several paths, such as (0,1,1) or (1,2,0) or (-1,0,2), and all get to the same tile! That would be a mess for comparing coordinates, and would make distance calculations almost impossible. With the addition of this “sum to zero” constraint, all paths to the tile yield the same coordinate of (-1,2,-1).
What about distances and coordinate conversion?
Distances in cube coordinates are also easy to calculate - just half the “Manhattan distance” between the two points:
def distance(q1, r1, s1, q2, r2, s2):
        return (abs(q1-q2) + abs(r1-r2) + abs(s1-s2)) / 2
We can add coordinates, multiply coordinates, calculate distances, and everything is simple so long as we remain in cube coordinates.
However, we will unavoidably sometimes need to convert from cube to cartesian coordinates. For example, while I built the above hex grids using cube coordinates, I plotted them in matplotlib, which wants cartesian coordinates to place each hex. Converting to cartesian coordinates will also allow us to find the distance between hex tiles “as the crow flies,” rather than in path-length, which may be desirable. So how do we convert back to xy coordinates?
First, we can disregard the s coordinate. Since all coordinates sum to zero, s = -1 * (q + r), so it represents redundant information, and we can describe the positions of each tile solely using the first two coordinates.
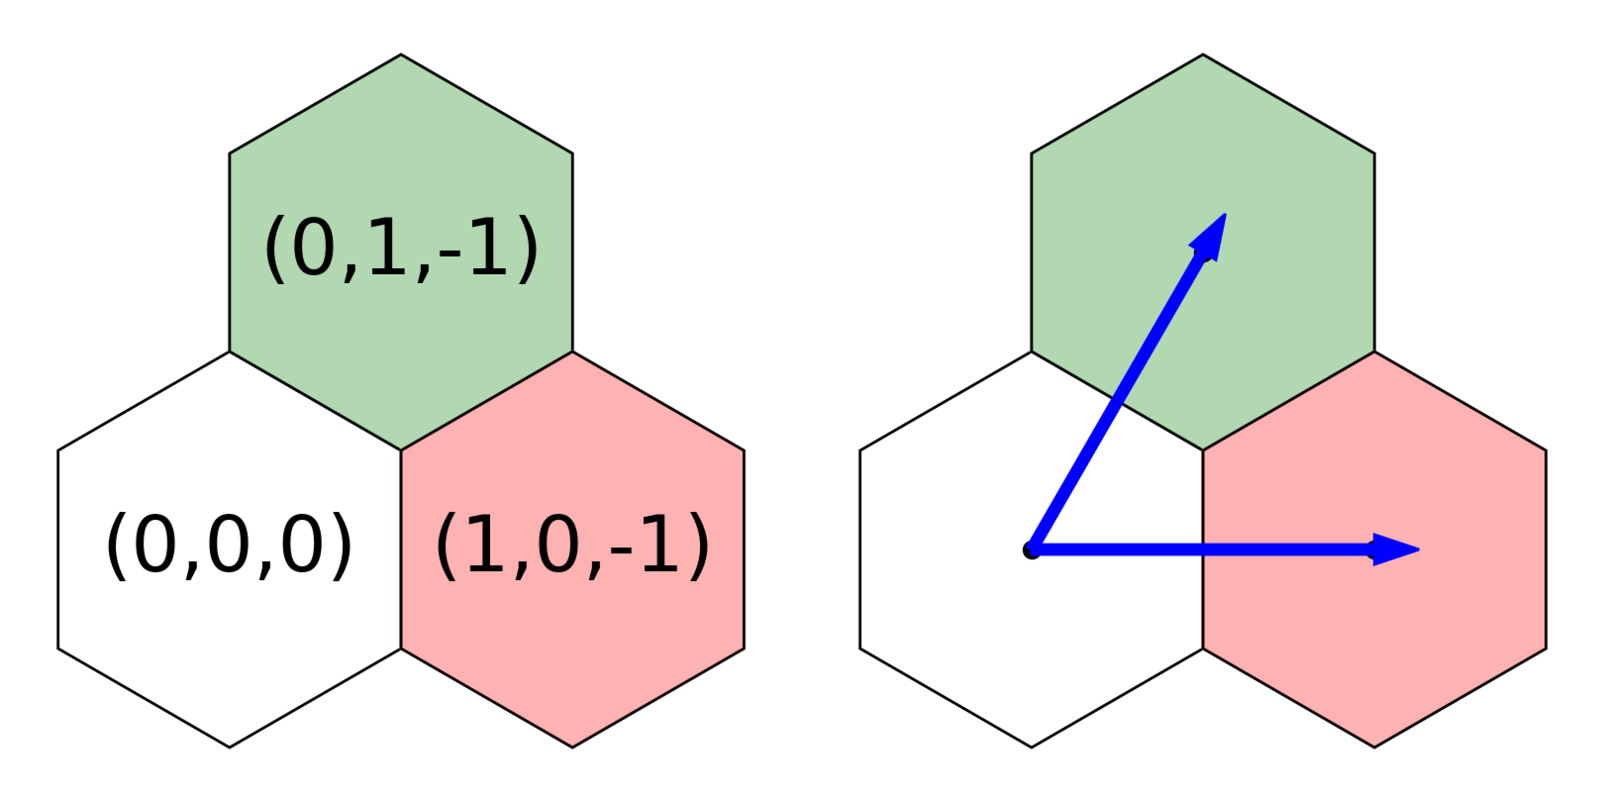
We can also tell through the example above that changing the q coordinate contributes only to changing the x-axis, while changing the r coordinate shifts both the x- and y-axes. Let’s set aside the q coordinate for the moment and focus on how much r contributes to each cartesian dimension.
Let’s visualize the arrow from (0,0,0) to (0,1,-1) as the hypotenuse of a triangle:
We want to break down the vector of length r=1 into x and y components. You may recognize this as a 30-60-90 triangle, or you could use some geometric identities: the internal angles of a hexagon are 120-degrees, and this triangle will bisect one, so theta must be 60-degrees. Regardless of how you get there, we land at our triangle identities:
From here we can easily solve for the x and y components of r, using 2a = r:
We know that (0,1,-1) is halfway between (0,0,0) and (1,0,-1) on the x-axis, so q must contribute twice as much to the x-axis as r does. Therefore, we can solve for the full cartesian coordinates of a hex using the cube coordinates as follows:
This works great! But it leaves the hexagons with a radius of sqrt(3) / 3, which may be inconvenient for some applications. For example, if you were physically manufacturing these hexagons, like making tiles for a board-game, they’d be much easier to cut to size if they had a radius of one. Therefore, you will often see the conversion math from cube to cartesian coordinates written with a constant multiple of sqrt(3), like:
Since this is a constant multiple, it just re-scales the graph, so all the distance measurements and convenient properties of the system remain the same, but hexagons now have an integer radius.
This is the most interesting thing in the world, where do I learn more?
If you are also excited by these coordinate systems, and want to read more about the logic behind cube coordinates, path-finding, line-drawing, wrapping around the borders of a map, and so on, then I highly recommend the Red Blob Games Hexagon article, which goes into much more detail.
Image Dithering in Color!
Posted 1/17/2023
In my last post I demonstrated how to perform image dithering to convert colored images to black and white. This consists of converting each pixel to either black or white (whichever is closer), recording the amount of “error,” or the difference between the original luminoscity and the new black/white value, and propagating this error to adjoining pixels to brighten or darken them in compensation. This introduces local error (some pixels will be converted to white when their original value is closer to black, and vice versa), but globally lowers error, producing an image that appears much closer to the original.
I’m still playing with dithering, so in this post I will extend the idea to color images. Reducing the number of colors in an image used to be a common task: while digital cameras may be able to record photos with millions of unique colors, computers throughout the 90s often ran in “256 color” mode, where they could only display a small range of colors at once. This reduces the memory footprint of images significantly, since you only need 8-bits per pixel rather than 24 to represent their color. Some image compression algorithms still use palette compression today, announcing a palette of colors for a region of the image, then listing an 8- or 16-bit palette index for each pixel in the region rather than a full 24-bit color value.
Reducing a full color image to a limited palette presents a similar challenge to black-and-white image dithering: how do we choose what palette color to use for each pixel, and how do we avoid harsh color banding?
We’ll start with a photo of a hiking trail featuring a range of greens, browns, and whites:

Let’s reduce this to a harsh palette of 32 colors. First, we need to generate such a palette:
#!/usr/bin/env python3
import numpy as np

def getPalette(palette_size=32):
    colors = []
    values = np.linspace(0, 0xFFFFFF, palette_size, dtype=int)
    for val in values:
        r = val >> 16
        g = (val & 0x00FF00) >> 8
        b = val & 0x0000FF
        colors.append((r,g,b))
    return colors
I don’t know much color theory, so this is far from an “ideal” spread of colors. However, it is 32 equally spaced values on the numeric range 0x000000 to 0xFFFFFF, which we can convert to RGB values. We can think of color as a three dimensional space, where the X, Y, and Z axes represent red, green, and blue. This lets us visualize our color palette as follows:
import matplotlib.pyplot as plt

def plotPalette(palette):
    fig = plt.figure(figsize=(6,6))
    ax = fig.add_subplot(111, projection='3d')
    r = []
    g = []
    b = []
    c = []
    for color in palette:
        r.append(color[0])
        g.append(color[1])
        b.append(color[2])
        c.append("#%02x%02x%02x" % color)
    g = ax.scatter(r, g, b, c=c, marker='o', depthshade=False)
    ax.invert_xaxis()
    ax.set_xlabel('Red')
    ax.set_ylabel('Green')
    ax.set_zlabel('Blue')
    plt.show()
Which looks something like:
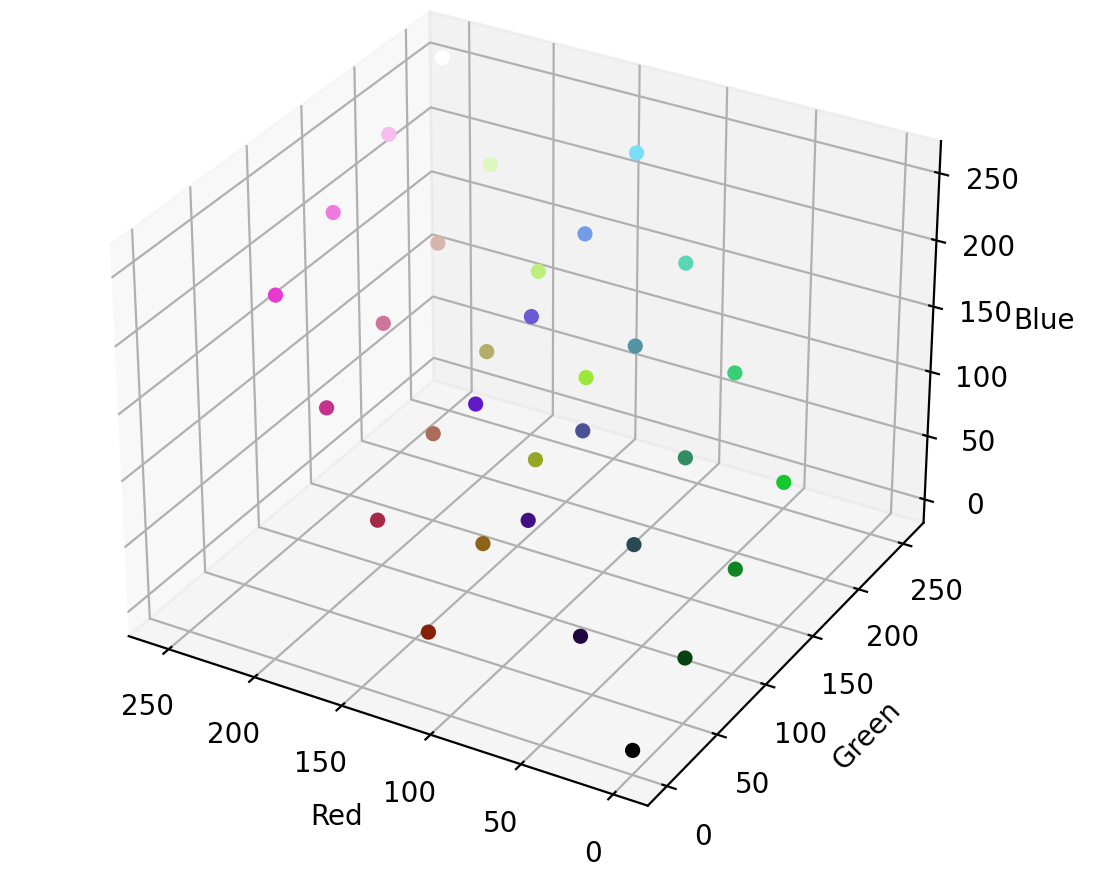
Just as in black-and-white image conversion, we can take each pixel and round it to the closest available color - but instead of two colors in our palette, we now have 32. Here’s a simple (and highly inefficient) conversion:
# Returns the closest rgb value on the palette, as (red,green,blue)
def getClosest(color, palette):
    (r,g,b) = color
    closest = None #(color, distance)
    for p in palette:
        # A real distance should be sqrt(x^2 + y^2 + z^2), but
        # we only care about relative distance, so faster to leave it off
        distance = (r-p[0])**2 + (g-p[1])**2 + (b-p[2])**2
        if( closest == None or distance < closest[1] ):
            closest = (p,distance)
    return closest[0]

def reduceNoDither(img, palette, filename):
    pixels = np.array(img)
    for y,row in enumerate(pixels):
        for x,col in enumerate(row):
            pixels[y,x] = getClosest(pixels[y,x], palette)
    reduced = Image.fromarray(pixels)
    reduced.save(filename)

img = Image.open("bridge.png")
palette = getPalette()
reduceNoDither(img, palette, "bridge_32.png")
The results are predictably messy:

Our palette only contains four colors close to brown, and most are far too red. If we convert each pixel to the closest color on the palette, we massively over-emphasize red, drowning out our greens and yellows.
Dithering to the rescue! Where before we had an integer error for each pixel (representing how much we’d over or under-brightened the pixel when we rounded it to black/white), we now have an error vector, representing how much we’ve over or under emphasized red, green, and blue in our rounding.
As before, we can apply Atkinson dithering, with the twist of applying a vector error to three dimensional color points:
# Returns an error vector (delta red, delta green, delta blue)
def getError(oldcolor, newcolor):
    dr = oldcolor[0] - newcolor[0]
    dg = oldcolor[1] - newcolor[1]
    db = oldcolor[2] - newcolor[2]
    return (dr, dg, db)

def applyError(pixels, y, x, error, factor):
    if( y >= pixels.shape[0] or x >= pixels.shape[1] ):
        return # Don't run off edge of image
    er = error[0] * factor
    eg = error[1] * factor
    eb = error[2] * factor
    pixels[y,x,RED] += er
    pixels[y,x,GREEN] += eg
    pixels[y,x,BLUE] += eb

def ditherAtkinson(img, palette, filename):
    pixels = np.array(img)
    total_pixels = pixels.shape[0] * pixels.shape[1]
    for y,row in enumerate(pixels):
        for x,col in enumerate(row):
            old = pixels[y,x] # Returns reference
            new = getClosest(old, palette)
            quant_error = getError(old, new)
            pixels[y,x] = new
            applyError(pixels, y,   x+1, quant_error, 1/8)
            applyError(pixels, y,   x+2, quant_error, 1/8)
            applyError(pixels, y+1, x+1, quant_error, 1/8)
            applyError(pixels, y+1, x,   quant_error, 1/8)
            applyError(pixels, y+1, x-1, quant_error, 1/8)
            applyError(pixels, y+2, x,   quant_error, 1/8)
    dithered = Image.fromarray(pixels)
    dithered.save(filename)
Aaaaaand presto!

It’s far from perfect, but our dithered black and white images were facsimiles of their greyscale counterparts, too. Pretty good for only 32 colors! The image no longer appears too red, and the green pine needles stand out better. Interestingly, the dithered image now appears flecked with blue, with a blue glow in the shadows. This is especially striking on my old Linux laptop, but is more subtle on a newer screen with a better color profile, so your mileage may vary.
We might expect the image to be slightly blue-tinged, both because reducing red values will make green and blue stand out, and because we are using an extremely limited color palette. However, the human eye is also better at picking up some colors than others, so perhaps these blue changes stand out disproportionately. We can try compensating, by reducing blue error to one third:

That’s an arbitrary and unscientific compensation factor, but it’s removed the blue tint from the shadows in the image, and reduced the number of blue “snow” effects, suggesting there’s some merit to per-channel tuning. Here’s a side-by-side comparison of the original, palette reduction, and each dithering approach:

Especially at a smaller resolution, we can do a pretty good approximation with a color selection no wider than a big box of crayons. Cool!
Image Dithering
Posted 1/16/2023
Dithering means intentionally adding noise to a signal to reduce large artifacts like color banding. A classic example is reducing a color image to black and white. Take this magnificent photo of my neighbor’s cat:

To trivially convert this image to black and white we can take each pixel, decide which color it’s closest to, and set it to that:
#!/usr/bin/env python3
from PIL import Image
import numpy as np

# Load image as grayscale
img = Image.open("kacie_color.png").convert("L")
pixels = np.array(img)
for y, row in enumerate(pixels):
    for x,col in enumerate(row):
        if( pixels[y,x] >= 127 ):
            pixels[y,x] = 255
        else:
            pixels[y,x] = 0
bw = Image.fromarray(pixels)
bw.save("kacie_bw.png")
But the result is not very satisfying:

The cat is white. Every pixel will be closer to white than black, and we lose the whole cat except the eyes and nose, along with most of the background detail. But we can do better! What if we set the density of black pixels based on the brightness of a region? That is, black regions will receive all black pixels, white regions all white, but something that should be a mid-gray will get closer to a checkerboard of black and white pixels to approximate the correct brightness.
One particularly satisfying way to approach this regional checkerboarding is called error diffusion. For every pixel, when we set it to black or white, we record how far off the original color is from the new one. Then we adjust the color of the adjacent pixels based on this error. For example, if we set a gray pixel to black, then we record that we’ve made an error by making this pixel darker than it should be, and we’ll brighten the surrounding pixels we haven’t evaluated yet to make them more likely to be set to white. Similarly, if we round a gray pixel up to white, then we darken the nearby pixels to make them more likely to be rounded down to black.
In Floyd-Steinberg dithering we process pixels left to right, top to bottom, and propagate the error of each pixel to its neighbors with the following distribution:
That is, pass on 7/16 of the error to the pixel right of the one we’re examining. Pass on 5/16 of the error to the pixel below, and a little to the two diagonals we haven’t examined yet. We can implement Floyd-Steinberg dithering as follows:
def getClosest(color):
    if( color >= 127 ):
        return 255 # White
    return 0 # Black

def setAdjacent(pixels, y, x, error):
    (rows,cols) = pixels.shape[0:2]
    if( y >= rows or x >= cols ):
        return # Don't run past edge of image
    pixels[y,x] += error

# Load image as grayscale
img = Image.open("kacie_color.png").convert("L")
pixels = np.array(img)
for y,row in enumerate(pixels):
    for x,col in enumerate(row):
        old = pixels[y,x]
        new = getClosest(old)
        pixels[y,x] = new
        quant_error = old - new
        setAdjacent(pixels, y,   x+1, quant_error*(7/16))
        setAdjacent(pixels, y+1, x-1, quant_error*(3/16))
        setAdjacent(pixels, y+1, x,   quant_error*(5/16))
        setAdjacent(pixels, y+1, x+1, quant_error*(1/16))
dithered = Image.fromarray(pixels)
dithered.save("kacie_dithered_fs.png")
The results are a stunning improvement:

We’ve got the whole cat, ruffles on her fur, the asphalt and wood chips, details on rocks, gradients within shadows, the works! But what are those big black flecks across the cat’s fur? These flecks of “snow” impact the whole image, but they don’t stand out much on the background where we alternate between black and white pixels frequently. On the cat, even small errors setting near-white fur to white pixels build up, and we periodically set a clump of pixels to black.
We can try to reduce this snow by fiddling with the error propagation matrix. Rather than passing all of the error on to adjacent pixels, and mostly to the pixel to the right and below, what if we ‘discount’ the error, only passing on 75% of it? This is the diffusion matrix used in Atkinson dithering:
The code hardly needs a change:
img = Image.open("kacie_color.png").convert("L")
pixels = np.array(img)
for y,row in enumerate(pixels):
    for x,col in enumerate(row):
        old = pixels[y,x]
        new = getClosest(old)
        pixels[y,x] = new
        quant_error = old - new
        setAdjacent(pixels, y,   x+1, quant_error*(1/8))
        setAdjacent(pixels, y,   x+2, quant_error*(1/8))
        setAdjacent(pixels, y+1, x+1, quant_error*(1/8))
        setAdjacent(pixels, y+1, x,   quant_error*(1/8))
        setAdjacent(pixels, y+1, x-1, quant_error*(1/8))
        setAdjacent(pixels, y+2, x,   quant_error*(1/8))
dithered = Image.fromarray(pixels)
dithered.save("kacie_dithered_at.png")
And the snow vanishes:

This is a lot more pleasing to the eye, but it’s important to note that the change isn’t free: if you look closely, we’ve lost some detail on the cat’s fur, particularly where the edges of her legs and tail have been ‘washed out.’ After all, we’re now ignoring some of the error caused by our black and white conversion, so we’re no longer compensating for all our mistakes in nearby pixels. This is most noticeable in bright and dark areas where the errors are small.
Closing Thoughts
I really like this idea of adding noise and propagating errors to reduce overall error. It’s a little counter-intuitive; by artificially brightening or darkening a pixel, we’re making an objectively worse local choice when converting a pixel to black or white. Globally, however, this preserves much more of the original structure and detail. This type of error diffusion is most often used in digital signal processing of images, video, and audio, but I am curious whether it has good applications in more distant domains.
If you enjoyed this post and want to read more about mucking with images and color, you may enjoy reading my post on color filter array forensics.
SQL for Scientists
Posted 12/03/2022
My lab group recently asked me to give a tutorial on using SQL databases in science. While we are all complex systems scientists, my background is in computer science and STS, and many of my colleagues come from physics, mathematics, and philosophy, so we learn a great deal from one another. I’ve turned my slides into a blog post here, like my last lab talk on using Git for scientific software development.
What is a database?
A database is a piece of software for storing and organizing your data. Most importantly, databases make it easy to query your data, asking for subsets of your data that match a specific pattern you are interested in.
If you currently store your data in formats like CSV or JSON, and write lots of code for reading this data and searching through it for pieces relevant to your research question, our goal will be to offload all of this logic from your own code to a database. It will run much faster, it will be faster to write, and it will help you avoid bugs while expressing complicated questions simply.
There are many types of databases, but for this post I’ll split them along two axis: do they run locally (as part of your research code, storing data in a single file) or remotely (running as an independent process you speak to over the network), and does the database use SQL (a language for expressing sophisticated data queries) or not. Here’s a small subset of databases along these axes:
| Local | Remote | |
| SQL | SQLite, DuckDB | Postgresql, MySQL, MariaDB, MSSQL, … |
| NoSQL | Pandas (sorta), BerkeleyDB, … | Redis, MongoDB, Firebase, … |
In this post I’ll be focusing on SQLite and Postgresql as examples. I’ll briefly talk about NoSQL databases at the end, and the scenarios where they might be preferable to SQL databases.
SQLite
SQLite stores all data in one file on your hard drive. SQLite is a library, so the database software runs inside of the software you write. It is trivial to set up, pretty fast (especially for queries), and has most database features we will want.
Critically, SQLite is ill-suited to concurrency. Since SQLite runs inside of your software, two different Python scripts can easily try to write to the same database file at the same time, risking catastrophic data corruption. You can build sophisticated locking mechanisms to ensure only one program accesses a database at once, but this adds a serious performance bottleneck. SQLite is really intended for a single piece of software to store data, not live setups where several applications write data at the same time.
Postgresql
Postgres runs as a software daemon; it runs all the time, storing data in a series of files and caches that it manages. Whether postgres is running on your own computer or another computer, your research software will communicate with postgresql over the network.
This difference in design means that postgres requires some additional bureaucracy to set up: users and passwords, databases and permissions and authentication. In return however, postgres is even faster than SQLite, and handles concurrent access from many applications trivially. Postgres also has a number of advanced features that are unavailable in SQLite.
Relational Databases with SQL
Relational databases store data in tables (think spreadsheets), and in the relationships between tables.
| userid | firstname | lastname | status |
| zerocool | Dade | Murphy | Undergradute |
| acidburn | Kate | Libby | Undergradute |
| joey | Joey | Pardella | Undergradute |
| cerealkiller | Emmanuel | Goldstein | Undergradute |
| phantomphreak | Ramon | Sanchez | Undergradute |
| lord_nikon | Paul | Cook | Graduate |
| building | room | desk | userid |
| Sage | 113 | 1 | zerocool |
| Sage | 113 | 2 | acidburn |
| Perkins | 208 | 7 | joey |
| West | 302 | 4 | lord_nikon |
You request data from a table using a SELECT statement of the form SELECT columns FROM table WHERE row matches condition. For example:
SELECT userid FROM desks WHERE building='Innovation' AND room=413;
You can also combine multiple tables during a SELECT to gather related information. Here we fetch the names of all graduate students with a desk assigned to them, by selecting rows from the desks table and combining them with matching entries from the user table where the user IDs of both rows match:
SELECT firstname,lastname FROM desks
        LEFT JOIN users ON desks.userid=users.userid
        WHERE status='Graduate';
The following are the main commands for interacting with a SQL database to create relations, add, remove, and update information in relations, and select information from relations:
| Command | Description |
| SELECT | Return some columns from a relation |
| INSERT | Add data to a relation |
| DELETE | Remove data from a relation |
| UPDATE | Modify data in a relation |
| CREATE | Create a new relation (table, view, index) |
| DROP | Remove a relation |
| EXPLAIN | Show how a query will access data |
So that’s all fine in theory, but how do we write software that actually uses a database?
Connecting to SQLite
To connect to a SQLite database from Python we first supply a database filename, open a cursor from the connection, then use the cursor to send a query and get back a 2D array of results.
import sqlite3

conn = sqlite3.connect("university.db")
c = conn.cursor()
c.execute("SELECT firstname,lastname,building,room FROM desks LEFT JOIN users ON desks.userid=users.userid")
for (f,l,b,r) in c.fetchall():
        print("%s %s has a desk in %s %d" % (f,l,b,r))
conn.commit() # Save any CREATE/INSERT changes to the database
conn.close()
You can think of the cursor as a finger tracking your position in the database. Multiple cursors allow us to make multiple queries from the same database and track which results were associated with which request.
Connecting to Postgresql
Interacting with Postgres is similar to SQLite: we connect to the database, then open a cursor from the connection, and use the cursor to send queries and get results. However, Postgres is a daemon accessible over the network, so we’ll need to supply a hostname and port number where the SQL server can be found, the name of the database we want to reach, and a username and password authorized to connect to that database.
import psycopg2

try:
        conn = psycopg2.connect(host="127.0.0.1", port="5432",
                user="registrar", password="hunter2",
                database="university_users")
        c = conn.cursor()
        c.execute("SELECT firstname,lastname,building,room FROM desks LEFT JOIN users ON desks.userid=users.userid")
        for (f,l,b,r) in c.fetchall():
                print("%s %s has a desk in %s %d" % (f,l,b,r))
except (Exception, Error) as error:
        print("Error while connecting to PostgreSQL", error)
finally:
        if( conn ):
                conn.commit()
                conn.close()
Parameterized Queries
Often your SQL statements will depend on other variables, and can’t be written as constant strings ahead of time. It may be tempting to assemble the SQL statement using string concatenation to insert variables. Never do this.
Consider the following example:
c.execute("SELECT userid,firstname,lastname FROM users WHERE lastname LIKE '" + name + "'")
matches = c.fetchall()
Given a student’s last name, look up all students with that name. You might find functionality like this on your university’s student directory. But what if a user enters input like ' OR 'a'='a? The query now reads:
SELECT userid,firstname,lastname FROM users WHERE lastname LIKE '' OR 'a'='a'
While a little clunky, this will return every user in the database. Worse yet, a malicious user might construct a query like:
SELECT userid,firstname,lastname FROM users WHERE lastname LIKE '' OR password LIKE 'A%'
This would get them a list of all users whose password hashes start with ‘A’, then another query for ‘AA’, ‘AB’, and slowly an attacker can reconstruct the password hashes of every user at the university. This kind of attack is called a SQL Injection, and is a common vulnerability in websites. While scientific code is less likely to be directly attacked than a website, if you’re working with real-world data, especially web-scraped or user-gathered data, there can be all kinds of garbage in your input.
To avoid this vulnerability you can write your query first with placeholders for parameters, then tell SQL to complete the statement on your behalf. In SQLite this looks like:
c.execute("SELECT userid,firstname,lastname FROM users WHERE lastname LIKE '?'", [name])
Or in Postgresql:
c.execute("SELECT userid,firstname,lastname FROM users WHERE lastname LIKE '%s'", [name])
In either case, the SQL engine will properly escape any text in the name field, ensuring that it’s interpreted as a string, and never as a SQL statement.
Constraints
Real-world data is messy. Maybe you assume that every office at a school is assigned to an employee or graduate student, but some were assigned to recent graduates or retirees and haven’t been re-assigned. Maybe you assume that all students have last names, but some international students come from cultures that use mononyms, and the last name field is empty. If you don’t check these underlying assumptions, you might not learn that you’ve made a mistake until hours of debugging later! Fortunately, SQL provides an easy way to describe and enforce your assumptions about data through constraints.
CREATE TABLE users(
        userid TEXT PRIMARY KEY,
        firstname TEXT NOT NULL,
        lastname TEXT,
        status TEXT NOT NULL
);
This definition of the user table includes four text fields, three of which cannot be empty. Further, the userid field must be unique: you can have two students with the same first and last name, but they must have different usernames. We can add more detailed restrictions to the desk-assignment table:
CREATE TABLE desks(
        building TEXT NOT NULL,
        room INT NOT NULL,
        desk INT NOT NULL,
        userid TEXT,
        FOREIGN KEY(userid) REFERENCES users(userid),
        UNIQUE(building,room,desk)
);
Here, we’ve explicitly said that the userid field must match some user ID in the users table. We’ve also said that while there can be multiple rooms in a building, and multiple desks in a room, there cannot be multiple desk 4’s in room 112 of Sage hall: the combination of building name, room number, and desk number must be unique.
If we try to insert any data into these tables that violates the described constraints, SQL will throw an exception instead of adding the new rows. Like unit testing but for your input data, constraints can help you be confident that your data follows the logic you think it does.
Indices, or how to make your database super fast
Compared to parsing CSV or JSON in Python and searching for the data you want, SQL will run inconceivably fast. But if you’re storing several gigabytes or more in your tables, even SQL databases will slow down. With a little bit of forethought we can make SQL queries run much faster.
Let’s say you have all your email stored in a database, with a structure something like:
CREATE TABLE emails(
        msgid TEXT PRIMARY KEY,
        from_address TEXT NOT NULL,
        to_address TEXT NOT NULL,
        subject TEXT NOT NULL,
        sent_date INT NOT NULL
);
If we want to search for all emails received in the last week then SQL needs to search through every email in the table to check their sent dates. This is obviously highly inefficient, but we can warn SQL that we’ll be making these kinds of queries:
CREATE INDEX time_index ON emails(sent_date);
Creating an index tells SQL to build a binary tree, sorting the emails by sent_date to reduce lookups from O(n) to O(log n), dramatically improving performance. We can also build indices on multiple columns at once:
CREATE INDEX from_time_index ON emails(from_address,sent_date);
And now we can look up emails from a particular user in a particular time window in O(log n) - even better! Both SQLite and Postgresql will automatically create indices for primary keys and unique constraints, since they’ll need to perform lookups during every new insert to make sure the constraints aren’t violated. You’ll often be selecting data based on unique characteristics too, so in practice it isn’t always necessary to declare indices explicitly.
Grouping and Counting
Many SQL functions aggregate information from multiple rows. For example, we can count the number of users with:
SELECT COUNT(*) FROM users;
There are a variety of aggregate functions, include AVG, MAX, MIN, and SUM.
Often we don’t want to apply aggregate functions to every row, but to a sub-group of rows. Imagine we have a table of course registrations, like:
CREATE TABLE course_registration(
        userid TEXT,
        coursecode INT,
        credits INT,
        FOREIGN KEY(userid) REFERENCES users(userid),
        UNIQUE(userid,coursecode)
);
To ask how many credits each student is registered for we might query:
SELECT userid,SUM(credits) FROM course_registration GROUP BY userid;
The GROUP BY clause clusters rows based on their userid, then runs the aggregate function on each group rather than on all rows. We could also list the students in descending order by credit count like:
SELECT userid,SUM(credits) AS total_credits FROM course_registration GROUP BY userid ORDER BY total_credits DESC;
Pandas Integration
Pandas is a ubiquitous Python package in data science. It makes it easy to store a table or a sequence of values as a Python object and perform some data analysis. It also integrates well with Seaborn, a package for statistical data visualization built on top of matplotlib. The two also integrate well with SQL. In just a couple lines, we can plot a histogram of how many credits students have registered for, from SQL to Pandas to Seaborn:
import sqlite3
import pandas as pd
import seaborn as sns
import matplotlib.pyplot as plt

conn = sqlite3.connect("registration.db")
df = pd.read_sql("SELECT userid,SUM(credits) AS registered_credits FROM course_registration GROUP BY userid", conn)
sns.histplot(data=df, x="registered_credits")
plt.set_title("Credit load across student body")
plt.savefig("credit_load.pdf", bbox_inches="tight")
conn.close()
Pandas will run a query for us (against SQLite, Postgresql, or a variety of other database types), put the result in a table with appropriate column names, and hand it off to Seaborn, which understands those same column names. Data analysis made easy!
Limitations of SQL, and when to use other tools
For all the awesomeness of SQL, there are some tasks it is ill-suited to. If all you need is a way to store a dictionary so it persists, and make that dictionary accessible to multiple programs, then SQL is way more complexity and overhead than you need. Redis fills this niche well, and is simple and fast as long as you use it for this purpose.
If you have an enormous amount of data, terabytes worth, and need to update that data continuously, then SQL is a poor fit: every SQL server can only make one change to a table at a time and will have some kind of internal locking mechanism to prevent multiple writes from conflicting. This would be disastrous if, for example, you wanted to store all tweets in a database and need to save data as millions of users tweet at once. Here, tools like MongoDB step up, offering multiple database “shards” that will periodically sync with one another. This setup offers “eventual consistency” where a new tweet might not be available to all users right away, but things propagate pretty quickly, and in return we can handle huge numbers of updates at once.
More generally, SQL is a poor choice for:
-
Storing large files: maybe store metadata about files in a table, along with a pathname to where the file can be found on disk?
-
Storing unstructured data: you need to know what your rows and columns will be to put information in a spreadsheet. If your data is not uniform enough to describe in this way, then a spreadsheet is inappropriate.
-
Storing arbitrarily structured or nested data: if your data comes in the form of deeply nested JSON or XML, then a spreadsheet may be a poor choice. This is not always the case: if you have some nested JSON representing a tree of comments and replies on a website, then you may be able to “flatten” the tree by making each comment into a unique row, and including a “parent commentID” as a column. However, if different levels of nesting can have a wide variety of tags and meanings, this conversion may not always make sense. If you find that you’re storing a blob of JSON as a column in your table, then a table may not be the best representation for you.
For very specific types of data, like GIS, or network/graph data, there are specialized databases that may offer more task-appropriate tools than SQL.
Conclusion
SQL databases are an invaluable tool for any data science. They allow researchers to organize a wide variety of data so that it is easily and quickly queried to identify patterns and answer questions. SQL can simplify your code, preclude nasty bugs via constraints, and integrates nicely with most programming languages, and especially with common data science software packages.
This post offers a brief tutorial on using SQL, but there is an enormous depth available to accomplish more complicated tasks. In particular, I have left out:
-
Views and Materialized Views
-
Subqueries and Common Table Expressions
-
Much more detail on joins, unions, grouping, and partitioning
-
Functions, stored procedures, and triggers
Hopefully this gives you enough of a foundation to start using SQL in scientific contexts, and look up more details as you need them.
Torrent Health Monitoring
Posted 8/21/2022
Distributed Denial of Secrets publishes most of our datasets via torrent. This minimizes infrastructural requirements for us: every time someone downloads a release, if they leave their torrent client running, they help us upload to other interested people. Once many people have mirrored our release it can remain available even if we stop seeding, completely self-hosted by the public. This is ideal, because with our budget we’re unable to maintain seed boxes for every release simultaneously; we keep offline backups, but virtual machine storage is more expensive.
This system typically works well, especially for rapidly distributing new releases. However, occasionally an older release will become unavailable, either because interest has waned and seeds have dropped offline, or because the trackers used by the torrent are no longer functional. If someone reports that a torrent is unavailable then we can pull the data from our backups and resume seeding, and issue a new magnet link containing an updated list of trackers. Unfortunately, that’s reactive, slow, and tedious. How can we proactively monitor the availability of all our torrents, to notify us when one requires attention?
Specifically, we want to build a dashboard that displays a list of torrents, and for each indicates how many trackers are online, how many peers those trackers are aware of, and how many peers can be found in the distributed hash table (DHT). It should track this information over the course of a day, a week, and a month, so we can distinguish between short-term and permanent loss of availability.
Every torrent client has the functionality to locate peers through trackers, and most modern clients can also find peers through the DHT. However, most clients do not provide a way to use that functionality without starting a download for the torrent, nor do they provide a way to export that peer information so we can plot availability over time. There are a few libraries for handling torrents, like libtorrent, but these also don’t easily expose peer-discovery independently from downloading. Fortunately, there are libraries for performing bittorrent DHT lookups, so our primary hurdle is implementing the client side of the bittorrent tracker protocol, described in BEP 0003, BEP 0015, and BEP 0023.
How do torrent trackers work?
Torrent trackers are conceptually simple:
-
A torrent or magnet link contains a list of trackers
-
Any client interested in downloading the torrent data contacts each tracker
-
The client announces the hash of the torrent they’re interested in, registering their interest with the tracker
-
The tracker returns a list of any other IP addresses that have recently registered interest in the same content
-
The client periodically re-registers its interest with the tracker, to identify any new peers, and ensure it remains discoverable to others
From there the client contacts each discovered peer directly, and negotiates a download. Since we’re only interested in peer discovery, we don’t have to follow along further than this.
Clients can communicate with trackers using two protocols: older trackers communicate using HTTP, but far more common is the newer, simpler, faster UDP-based protocol. In both protocols, clients can make announce requests, which announce their interest in a torrent, and scrape requests, which fetch some aggregated metadata about the number of clients interested in a torrent.
Unfortunately, scrape requests have little utility for our purposes: If one tracker says that it knows 7 peers, and another tracker says it knows 3, how many peers are there? 7? 10? Somewhere in-between? We can’t aggregate information across trackers without fetching the list of peer IP addresses from each tracker, which requires using an announce request.
The tracker HTTP API
The tracker HTTP protocol is deceptively simple. A tracker URL looks something like http://tracker.opentrackr.org:1337/announce. This contains the domain name of the tracker, the port number, and the resource for the request (typically “announce”). To send a request, the client adds several fields:
| Field | Description |
|---|---|
| info_hash | A URL-encoded version of the torrent sha256 hash |
| peer_id | A random string uniquely identifying the client |
| port | The port number on which the client can be reached |
| uploaded | The number of blocks the client has already uploaded |
| downloaded | The number of blocks the client has downloaded |
| left | How many blocks the client still needs to download |
Therefore a full request to a tracker may look something like:
http://tracker.opentrackr.org:1337/announce?info_hash=%5Bg%03%95%28%0A%3F%3F**%0A%CFs%D4K%2C%CE%0F%E1%AE&peer_id=foo&port=1234&uploaded=0&downloaded=0&left=0
Note that the uploaded, downloaded, and left fields are required, but are only hints. If the client is downloading a magnet link, it may not know how large the torrent data is, and therefore how much is left to download. This self-reported metadata isn’t verified in any way, the tracker just uses it to report some analytics.
Once the client makes an announce request to a tracker, the tracker responds with either an HTTP error, or with a text-encoded dictionary describing available peer data for the torrent. Great, so does the tracker respond with some JSON? XML? YAML? No, it responds with Bencode! This is a custom text-encoding scheme made for bittorrent metadata that can encode:
| Field type | Encoding rule | Example |
|---|---|---|
| integers | Prefix with an i, then the integer in ascii-base10, then an e |
7 becomes i7e |
| bytestrings | Length-prefixed, then a colon, then the string | “foo” becomes 3:foo |
| lists | Start with an l, then the contents of the list, then an e |
[2,3] becomes li2ei3ee |
| dictionaries | Start with a d, then the contents of the dictionary, then an e. Each entry consists of a string key, followed immediately by a value |
{"foo": 1, "bar": 2} becomes d3:fooi1e3:bari2ee |
The tracker may respond with a Bencoded dictionary with a key of failure reason and a value of some explanatory text string like “this tracker doesn’t have information on that torrent” or “you’ve been rate-limited”. Otherwise, it’ll respond in one of two ways:
Bencoded dictionaries
In the older bittorrent tracker standard 3, trackers respond with a dictionary containing the key peers and a value of a list, where each entry is a dictionary, containing contact information for that peer. For example (translated to json):
{
    "peers":
        [
            {"ip": "1.2.3.4", "port": 4567},
            {"ip": "2.3.4.5", "port": 5678}
        ]
}
Or in the glorious bencode:
d5:peersl2:ip7:1.2.3.44:porti4567e22:ip7:2.3.4.54:porti5678eee
There may be a variety of other keys (a “peer ID” in the peer dictionary, or metadata like “number of seeds, peers, and leeches” at the top level), but this is all we need for our purposes.
Bencoded compact bytestring
All this text encoding gets a little tedious, so in an amendment to the tracker spec (standard 23), trackers may now instead return a binary string in the “peers” field, like:
{
    "peers": "\x04\x03\x02\x01\x04\xD2\x05\x04\x03\x02\t)"
}
Or in bencode again:
d5:peers12:\x04\x03\x02\x01\x04\xD2\x05\x04\x03\x02\t)e
This is equivalent to the dictionary above: the first four bytes are an integer IP address, followed by two bytes for a port, then another six bytes for the next IP address and port. The hex-escaping is added here for illustration purposes; the tracker would return those raw bytes.
While this string compression doesn’t save much in our two-peer example, it’s significantly more compact when handling dozens or hundreds of peers.
The tracker UDP API
HTTP is unwieldy. It takes many packets, the server might use gzip compression, maybe the server requires HTTPS, or goes through some redirects before responding. Once the server responds, it might respond with a variety of HTTP errors, and while it should respond with bencoded data, servers often return HTML in error. Even when they return bencoded data, they sometimes follow the bencode spec incorrectly. In short, supporting HTTP in torrent clients is a complicated mess. But it doesn’t need to be this way! The information the client and server are exchanging is relatively simple, and we can communicate it in just a handful of UDP packets. So begins bittorrent specification 15.
First, we need to perform a handshake with the server:
The client sends a magic number confirming that they are using the torrent tracker protocol, as opposed to random Internet traffic like a port scan. Then they send an action (0: connect), and a random transaction ID to identify datagrams connected to this session.
If the tracker is online, it will respond to complete the handshake:
The tracker sends back action 0 (responding to the connect request), the same transaction ID the client sent, and a random connection ID. The client will include this connection ID in future datagrams. This handshake prevents IP address spoofing, as used in DNS amplification attacks where an attacker coerces a DNS server into flooding a third party with traffic.
The client may now send its announce request (action code 1: announce):
This uses the same connection ID and a new transaction ID from the previous step, followed by the info hash of the torrent, and a peer ID representing this client. Then the client sends some metadata regarding how far along its download is (matching the downloaded, left, and uploaded fields in the HTTP spec). Finally, the client sends the IP address and port it can be reached at, although trackers will typically ignore the IP address field and use the IP that sent the request (again to prevent spoofing), a key identifying the client, and an unused num_wanted field.
If the client has both an IPv4 and an IPv6 address, and is therefore looking for both v4 and v6 peers, then it must make two announce requests, over v4 and v6, using the same key. This allows the tracker to avoid “double-counting” the number of peers interested in a torrent.
Finally, the tracker responds with peer data:
Here, the action and transaction ID match the previous datagram, and the interval indicates how long the client should cache results for before polling the tracker again. The leechers and seeders counts are the tracker’s guess as to how many peers are mostly-downloading or mostly-uploading based on the downloaded, left, and uploaded fields from each announce request. These counts are not authoritative, or confirmed by the tracker in any way.
And at last, the tracker responds with a series of IP addresses and port numbers: 4 bytes per address (assuming IPv4, 16 bytes for IPv6), and two bytes per port number.
That’s all there is to the UDP protocol! Keep in mind that all values should follow network byte-order (big endian). While the diagrams make this protocol look complicated, there’s far less parsing or error handling needed than for the HTTP version, no external libraries required, and the entire exchange occurs in just 4 packets. No wonder the majority of torrents only use UDP trackers!
Creating the dashboard
With the tracker protocol implemented, we can take a list of torrents, extract their list of trackers, and look up peers from each tracker. We can also look up peers in the DHT using third party code. From here, it’s a simple process to make a SQL database to track all that information with timestamps, select results from those tables based on their age, and at last throw up an interface to peruse it:
In the hopes that this code might benefit others, it’s been released on GitHub.
Distinguishing In-Groups from Onlookers by Language Use
Posted 6/8/2022
This post is a non-academic summary of my most recent paper, which can be found here. It’s in a similar theme as a previous paper, which I discussed here, but this post can be read on its own. An enormous thank you to my fantastic co-authors Josh Minot, Sam Rosenblatt, Guillermo de Anda Jáuregui, Emily Moog, Briane Paul V. Samson, Laurent Hébert-Dufresne, and Allison M. Roth.
If you wanted to find QAnon believers on Twitter, YouTube, or Reddit, you might search for some of their flavorful unique vocabulary like WWG1WGA (“Where we go one, we go all”). To find cryptocurrency enthusiasts, you might search for in-group phrases like HODL or WAGMI, or “shitcoins”, or specific technologies like “NFT” or “ETH”. This works well for new, obscure communities, when no one else has picked up on their vocabulary. However, once a community reaches the limelight, the keyword-search strategy quickly deteriorates: a search for “WWG1WGA” is now as likely to find posts discussing QAnon, or ridiculing them, as it is to identify true believers.
Human observers with some contextual understanding of a community can quickly distinguish between participants in a group, and discussion about (or jokes about) a group. Training a computer to do the same is decidedly more complicated, but would allow us to examine exponentially more posts. This could be useful for tasks like identifying covid conspiracy communities (but distinguishing them from people talking about the conspiracists) or identifying a hate group (but distinguishing from people discussing hate groups). This, in turn, could help us to study the broad effects of deplatforming, by more systematically examining where communities migrate when they’re kicked off a major site. Those possibilities are a long way off, but distinguishing participants in a group from onlookers talking about the group is a step towards the nuance in language processing we need.
Setup
Our study focuses on a simple version of this problem: given a subreddit representing an in-group, and a subreddit dedicated to discussing the in-group, automatically label commenters as being part of the in-group or onlookers based on the text of their comments. We use the following list of subreddit pairs:
| In-Group | Onlooker | Description |
|---|---|---|
| r/NoNewNormal | r/CovIdiots | NoNewNormal discussed perceived government overreach and fear-mongering related to Covid-19 |
| r/TheRedPill | r/TheBluePill | TheRedPill is part of the “manosphere” of misogynistic anti-feminist communities |
| r/BigMouth | r/BanBigMouth | Big Mouth is a sitcom focusing on puberty; BanBigMouth claimed the show was associated with pedophilia and child-grooming, and petitioned for the show to be discontinued |
| r/SuperStraight | r/SuperStraightPhobic | SuperStraight was an anti-trans subreddit, SuperStraightPhobic antagonized its userbase and content |
| r/ProtectAndServe | r/Bad_Cop_No_Donut | ProtectAndServe is a subreddit of verified law-enforcement officers, while Bad_Cop_No_Donut documents law enforcement abuse of power and misconduct |
| r/LatterDaySaints | r/ExMormon | LatterDaySaints is an unofficial subreddit for Mormon practitioners, while ExMormon hosts typically critical discussion about experiences with the church |
| r/vegan | r/antivegan | Vegan discusses cooking tips, environmental impact, animal cruelty, and other vegan topics. AntiVegan is mostly satirical, making fun of “vegan activists” |
Some of these subreddit pairs are directly related: r/TheBluePill is explicitly about r/TheRedPill. Other subreddit pairs are only conceptually connected: r/Bad_Cop_No_Donut is about law enforcement, but it’s not specifically about discussing r/ProtectAndServe. This variety should help illustrate under what conditions we can clearly distinguish in-groups from onlookers.
For each subreddit pair, we downloaded all comments made in each subreddit during the last year in which they were both active. In other words, if one or both subreddits have been banned, we grab the year of comments leading up to the first ban. If both subreddits are still active, we grab the comments from the last 365 days to present.
We discarded comments from bots, and comments from users with an in-subreddit average karma below one. This is to limit the effect of users from an onlooking subreddit “raiding” the in-group subreddit (or vice versa), and therefore muddying our understanding of how each subreddit typically writes.
What’s in the Data
Next, we want to identify the words used far more in the in-group than the onlooking group, or vice versa. There are a variety of ways of measuring changes in word-usage, including rank turbulence divergence (which words have changed the most in terms of their order of occurrence between one dataset and another) and Jensen-Shannon divergence (the difference in word frequency between each subreddit and a combination of the two subreddits).
For example, here’s a plot illustrating which words appear more prominently in r/NoNewNormal or r/CovIdiots, based on the words “rank”, where rank 1 is the most used word, and rank 10,000 is the 10,000th most-used word:
While we know both subreddits feature terms like “vaccine”, “mask”, and “covid”, this plot tells us that terms like “doomer”, “trump”, and “lockdown” are used disproportionately in our in-group, while disparaging terms like “idiot”, “stupid”, and “moron” are far more common in the onlooker group.
We can already see one limitation of this study: the most distinguishing term between our two subreddits is “covidiot”, a term developed on r/CovIdiots. We’re not just capturing some context around the in-group’s use of terminology, we’re identifying keywords specific to this community of onlookers, too.
Building a Classifier
Now that we’ve had a peek at the data, and have confirmed that there are terms that strongly distinguish one community from its onlookers, we want to build a classifier around these distinguishing terms. Specifically, for every user we want to get a big text string consisting of all of their comments, the classifier should take this comment string as input, and return whether the user is in the in-group or the onlooker group.
Since we know whether each user participates mostly in the in-group subreddit, or the onlooking subreddit, we’ll treat that as ground-truth to measure how well our classifier performs.
We built two classifiers: a very simple linear-regression approach that’s easy to reverse-engineer and examine, and a “Longformer” transformer deep-learning model that’s much closer to state-of-the-art, but more challenging to interrogate. This is a common approach that allows us to examine and debug our results using our simple method, while showing the performance we can achieve with modern techniques.
We trained the linear regression model on term frequency-inverse document frequency; basically looking for words common in one subreddit and uncommon in another, just like in the plot above. We configured the Longformer model as a sequence classifier; effectively “given this sequence of words, classify which subreddit they came from, based on a sparse memory of prior comments from each subreddit.”
Results
Here’s our performance on a scale from -1 (labeled every user incorrectly) to 0 (did no better than proportional random guessing) to 1 (labeled every user correctly):
| In-Group | Onlooker | Logistic Regression Performance | Longformer Performance |
|---|---|---|---|
| r/NoNewNormal | r/CovIdiots | 0.41 | 0.48 |
| r/TheRedPill | r/TheBluePill | 0.55 | 0.65 |
| r/BigMouth | r/BanBigMouth | 0.64 | 0.80 |
| r/SuperStraight | r/SuperStraightPhobic | 0.35 | 0.43 |
| r/ProtectAndServe | r/Bad_Cop_No_Donut | 0.50 | 0.55 |
| r/LatterDaySaints | r/ExMormon | 0.65 | 0.72 |
| r/vegan | r/antivegan | 0.49 | 0.56 |
Or, visually:
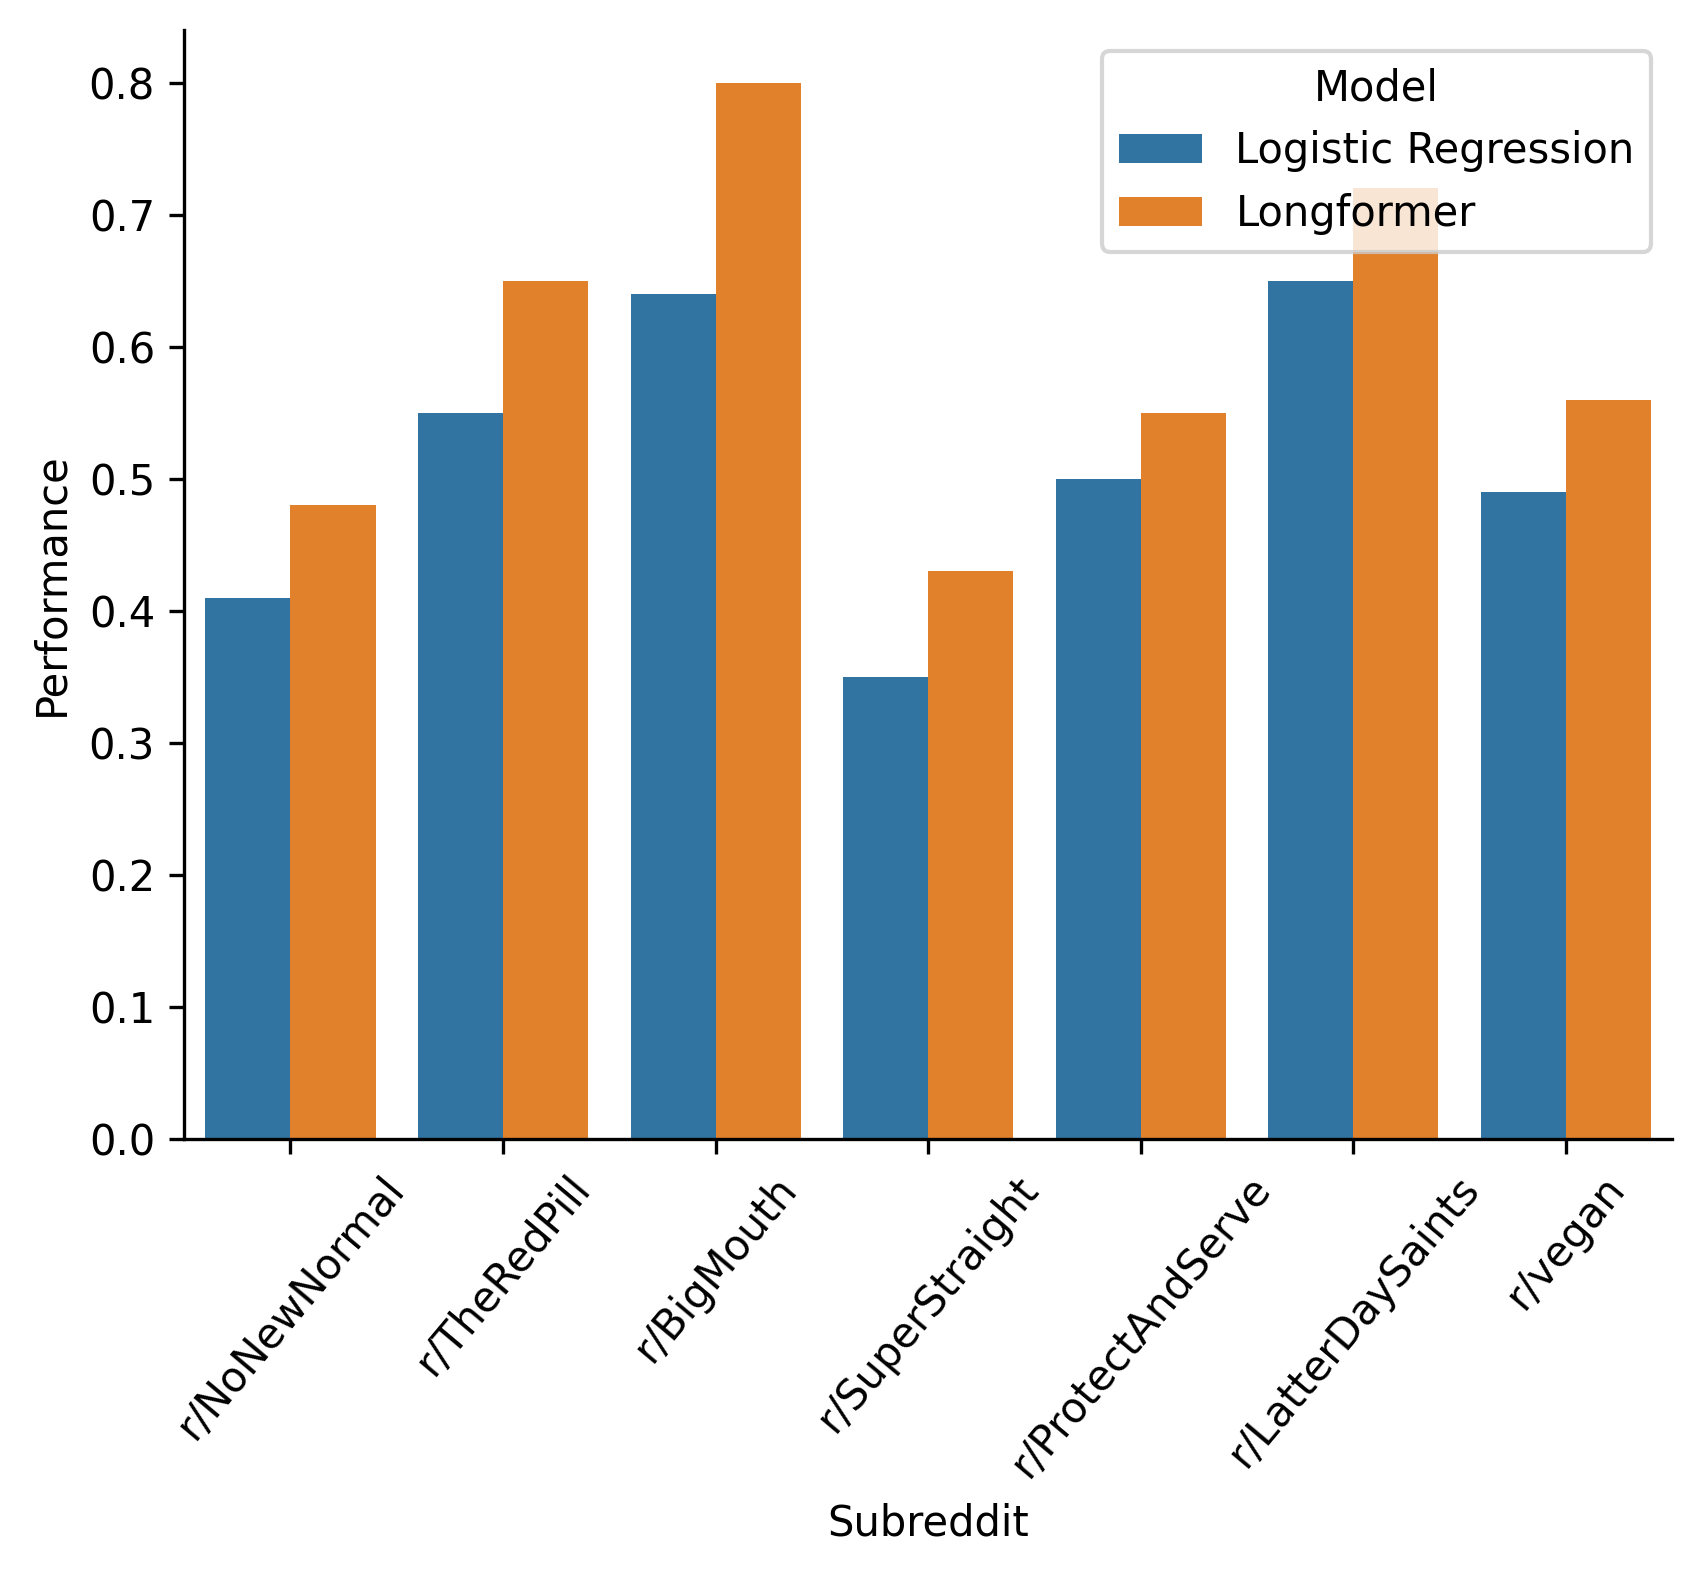
Much better than guessing in all cases, and for some subreddits (BigMouth, LatterDaySaints, and TheRedPill) quite well!
If a user has barely commented, or their comments all consist of responses like “lol”, classification will be near-impossible. Therefore, we can re-run our analysis, this time only considering users who have made at least ten comments, with at least one hundred unique words.
| In-Group | Onlooker | Logistic Regression Performance | Longformer Performance |
|---|---|---|---|
| r/NoNewNormal | r/CovIdiots | 0.57 | 0.60 |
| r/ProtectAndServe | r/Bad_Cop_No_Donut | 0.65 | 0.76 |
| r/LatterDaySaints | r/ExMormon | 0.80 | 0.83 |
| r/vegan | r/antivegan | 0.65 | 0.72 |
And visually again:
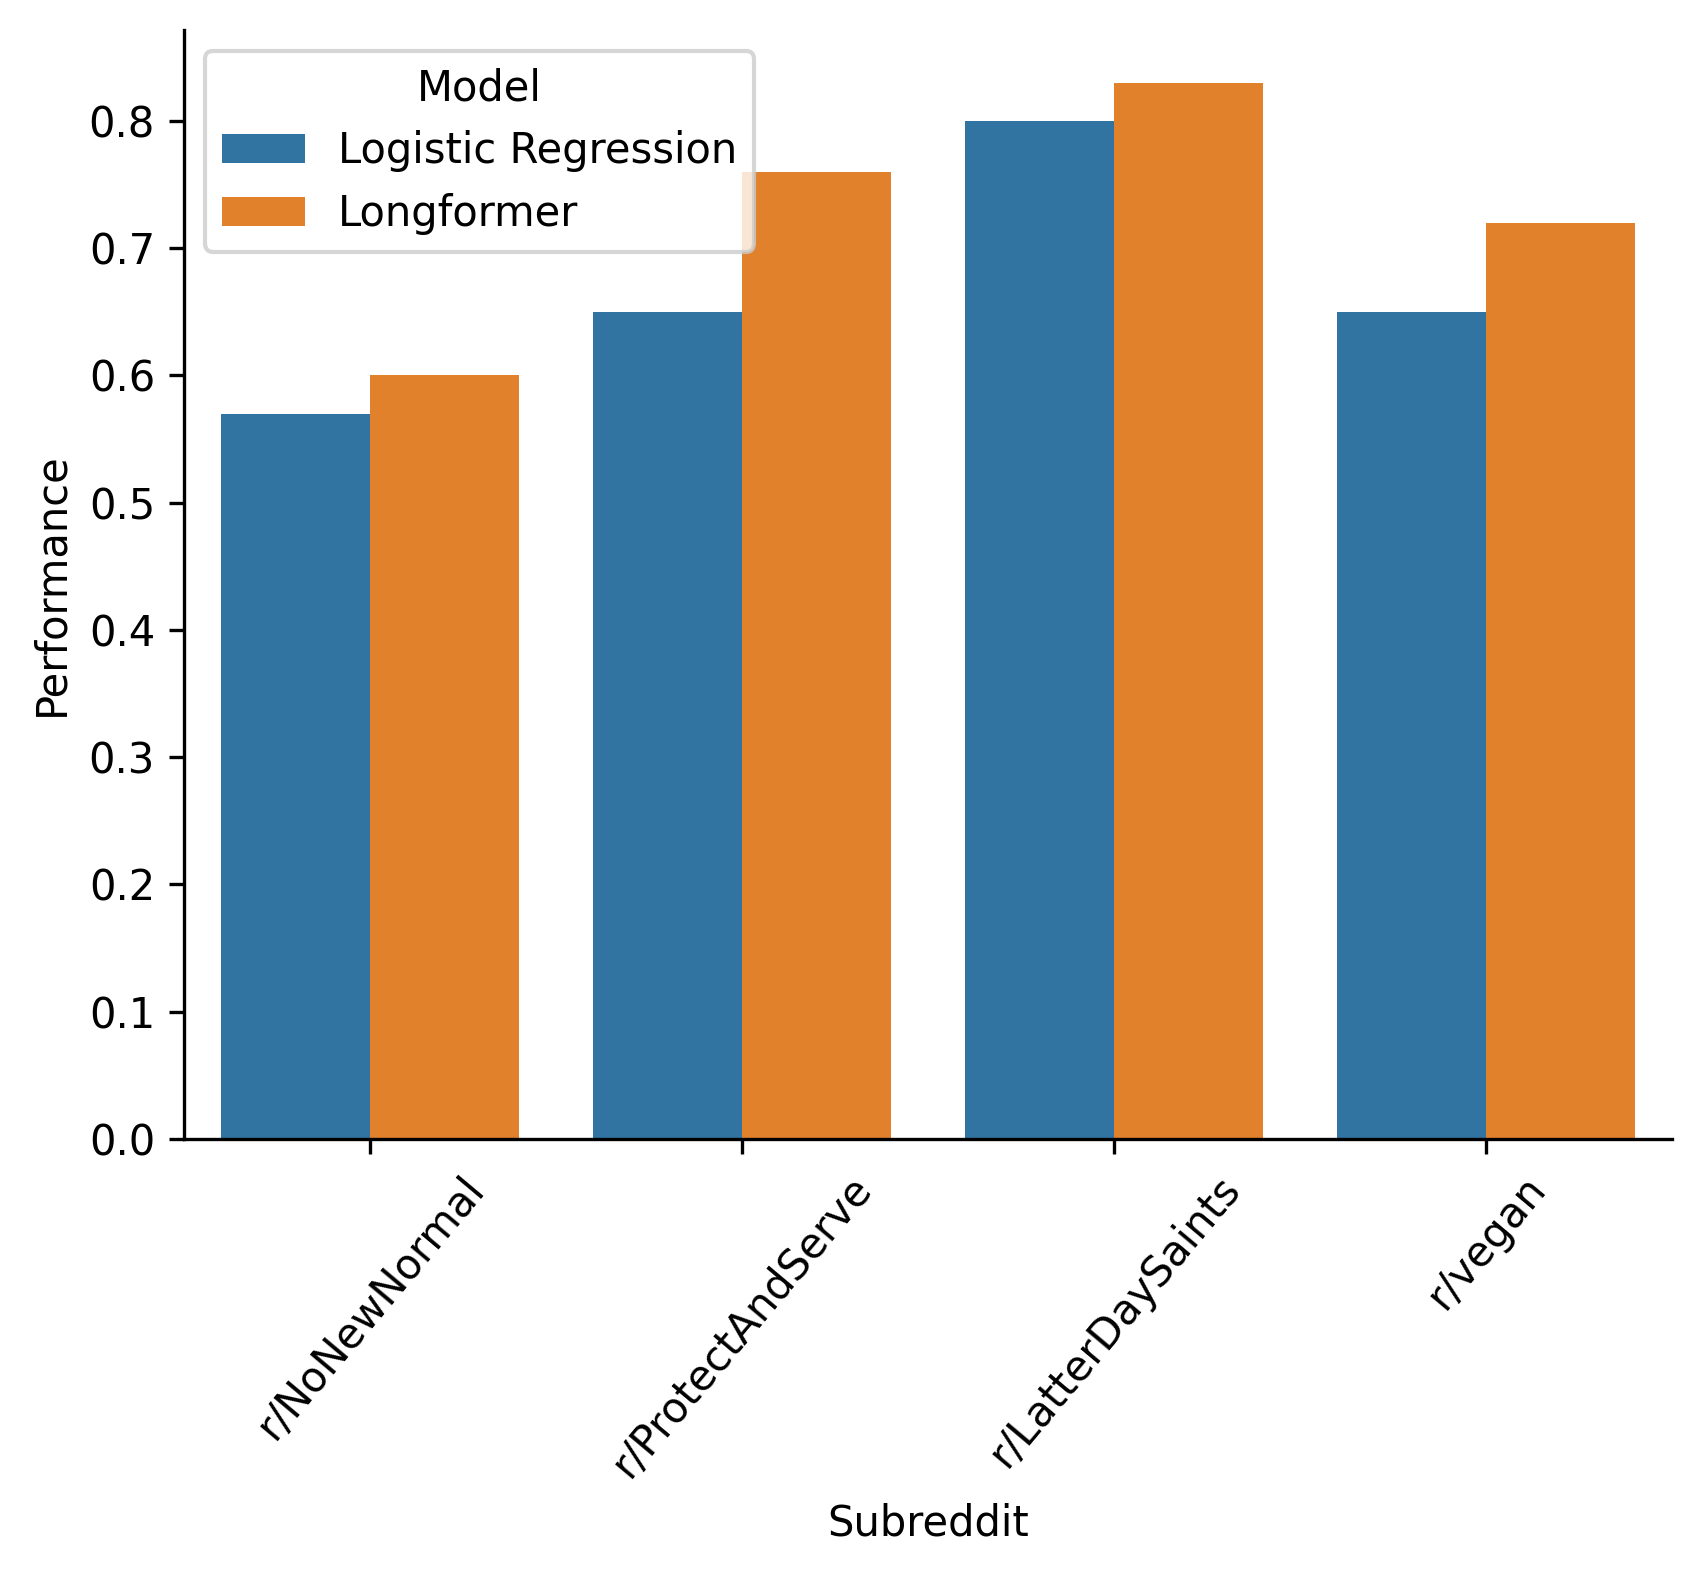
For a few subreddit pairs, the onlooking subreddit has too few comments left over after filtering for analysis to be meaningful. For the four pairs that remain, performance improves significantly when we ignore low-engagement users.
Similarly, we can examine what kinds of users the classifier labels correctly most-often:
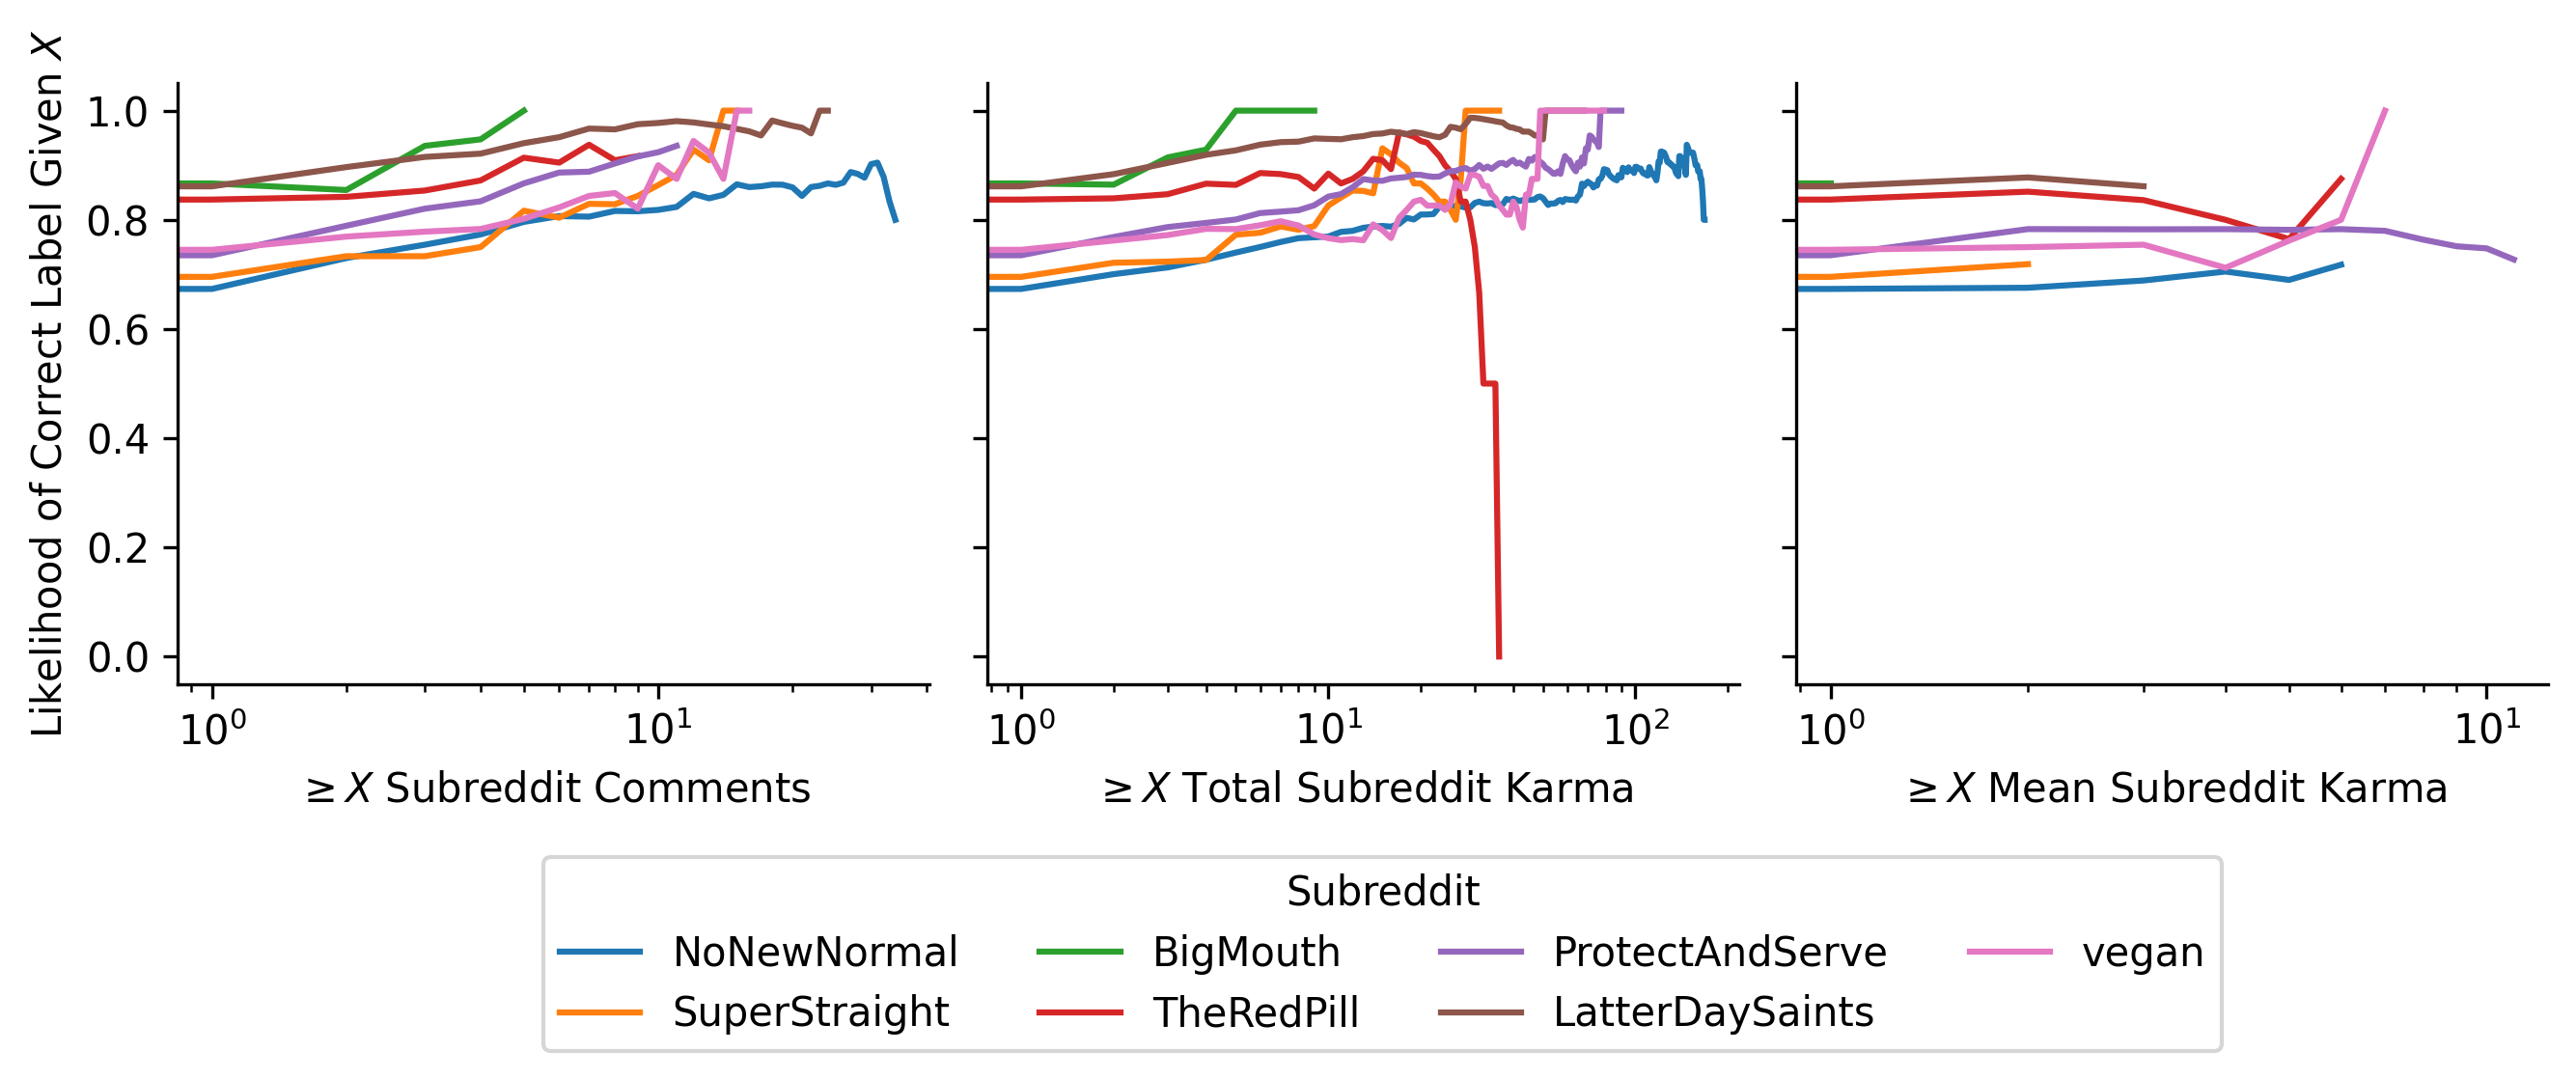
The classifier performs better on users with more comments (and therefore more text to draw from), and more karma in the subreddit (which typically correlates with number of comments unless the user is immensely unpopular), but does not significantly differ with mean subreddit karma. In other words, popular users who receive lots of karma on many of their comments, and therefore might be more representative of the subreddit’s views, are not easier to classify.
Conclusions, Limitations, Next Steps
For a first attempt at solving a new problem, we have some promising results. We can consistently distinguish users from an in-group and users from a specific onlooking group, based on the language of users’ posts. Our study focuses on subreddits, which provide a best-case scenario for classification: comments are neatly partitioned into the in-group and onlooker subreddits. If we studied Twitter users, for example, we’d have no baseline to determine whether our classifier was guessing correctly, or even a good way to feed it training data, without human annotators labeling thousands of Twitter accounts by hand.
It’s also unclear how well this classifier would function in a cross-platform environment. For example, could we train the classifier on a subreddit, and then classify Twitter or Discord users based on their comments? Theoretically, the same community will discuss the same topics on multiple platforms, likely with similar keywords. However, the design of each platform (such as the short character limits on Tweets) may constrain authors enough to make classification harder.
Finally, it’s unclear how well this classification will hold up over time. Would a classifier trained on last year’s comments still perform well on users from this year? Or will the discussion topics of a community have drifted too far for those old word frequencies to be useful? This could be especially important when communities migrate between platforms, when we may for example have old Reddit data and new Discord data.
Lots more to do, but I’m excited about these first steps!
Git and Code Versioning for Scientists
Posted 5/10/2022
I recently gave a talk to the Joint Lab on using git to write code collaboratively with other scientists. I’m going to recycle that talk in blog form, in case anyone else would like a quick crash-course. This post assumes that you’ve used git a few times before, and are trying to get a better handle on it.
My examples use the command line and diagrams to explain the concepts behind git operations. You may find graphical git software, like GitHub Desktop, or the git integration in your text editor, more approachable. That’s perfectly fine; I just find the command line makes git operations more explicit, and so is clearer for teaching.
What is Git?
Git is a version-control system: it tracks changes to files in a folder, typically source code, allowing developers to undo their changes, examine the history of changes, and merge changes that they and others have made.
A group of changes to one or more files is called a commit. Each commit includes a reference to the previous commit, creating a timeline of every change since the start of the project.
The current state of the repository can be described as the sum of the most recent commit, and every ancestor commit that came before it. The current state of the repository is referred to as HEAD.
A git branch is a series of commits. The default branch is typically called main or master. More on branches later.
Remote Servers
Git can technically be used offline: you can create a local repository on your computer, track changes to files in a project, and never share the commits with anyone. However, we most frequently use git as a collaboration tool, typically by creating a repository on a central site like GitHub or GitLab and giving multiple developers access.
When you clone a GitHub repository, your computer assigns a name to the remote server, origin by default. Your computer then downloads the repository contents, and creates two branches: an origin/main branch, representing the commits GitHub is aware of, and a main branch, representing your own work.
Pull
When you pull new changes down from GitHub, git first downloads the commits to the origin/main branch, then fast-forwards your own main branch to match:
Push
Similarly, when you push local changes to GitHub, you’re sending changes from your own main branch to GitHub, so the origin/main branch catches up to your own work:
Conflicts
If you are the only developer on a repository, and you only develop from one computer, then you can push and pull to your heart’s content. However, if someone else has pushed changes to GitHub since you have, then you have a conflict, where GitHub has commits that you don’t, and you have commits that GitHub doesn’t:
In order to sync your local commits with GitHub, you need to resolve the conflict with one of two strategies.
Rebasing
If the commits on GitHub (C in this diagram) edit different files than the local commits (D and E), then the “conflict” is purely bureaucratic. The file changes aren’t incompatible, you just need to re-order the commits to create a coherent timeline. The rebase command will rewrite your local commits so that they come after C:
The full commands to accomplish this are:
git fetch origin main
git rebase origin/main
The first downloads changes from GitHub (origin) to the origin/main branch, but does not attempt to combine them with the local main branch. The second rebases the local commits to occur after the origin/main commits.
Merging
If commit C does change the same files as commits D or E, then the two histories may be incompatible. In order to combine them, we need to add a new commit, F, that incorporates the changes from all three commits, possibly changing files further to make the changes mesh.
Similarly, the commands for this are:
git fetch origin main
git merge origin/main
If you’ve never run these commands before, that’s because git pull is shorthand for the above two commands!
Branches
So far we’ve only considered repositories with a single branch: main. However, using multiple branches is key to successful collaboration. You can create side branches to work on a new feature, or otherwise make large breaking changes to a codebase. Branches let you work in a corner, contain your mess, and only merge those changes back to the main branch when you’re done and ready to share.
Creating Local Branches
Creating a local branch is as easy as running:
git checkout -b new_feature
This creates a new branch called new_feature, and switches HEAD to track the new branch. When you add new commits, they’ll now be added to the new_feature branch instead of main:
Switching Branches
To switch back to the main branch, run git checkout main:
This will un-apply the changes from commits D and E, reverting the codebase to the state of the main branch. If you’ve made changes that you haven’t committed, git will not let you change branches. In other words, switching branches will never destroy your work.
When you’re ready to combine your changes from your side branch to the main branch, simply checkout the main branch, and run git merge new_feature or git rebase new_feature as appropriate.
Creating Remote Branches
By default, newly created branches only exist in your local repository, and are not pushed up to GitHub. This is so that you can do as much internal bookkeeping and branching as you want, without cluttering what other developers see. Make side branches to your heart’s content!
However, if you want to share your branch with other developers, to collaborate on a side branch without merging everything to main, then you need to create a “remote” branch.
If you already have a local branch checked out, you can create a corresponding remote branch (and then push to send those changes to GitHub) with:
git branch --set-upstream-to origin/new_feature
git push
If you are creating a new branch for the first time, and already know you want to share it with others, you can create the branch like:
git checkout -b new_feature origin/new_feature
In either case, your commit tree will now look like:
From now on, you can git push and git pull in the new_feature branch to sync it to GitHub’s origin/new_feature branch.
Common Pitfalls
Editing on the Wrong Branch
If you’ve made some changes to the main branch that you wanted to put on new_feature and you haven’t committed yet, then you can move those changes over by stashing them in a corner:
git stash
git checkout new_feature
git stash pop
Stashing uncommitted changes bypasses git’s rule about not permitting you to switch branches before committing, because your changes will not be overwritten this way.
Committing to the Wrong Branch
If you’ve already committed your changes to main instead of new_feature and you haven’t pushed yet then you can fix the mishap with:
git checkout new_feature
git merge main
git checkout main
git reset --hard HEAD~3
This will move the changes to the new_feature branch (by merging them in from main), then on the main branch, undoes the last three commits, rewriting history.
Since the commits are still referenced by the new_feature branch, no work is lost, but they no longer appear in the main branch’s history.
Reversing a Catastrophic Commit
Usually when you make a mistake, like committing a typo, the solution is to add a new commit that corrects the mistake. There is rarely any need to rewrite history and un-commit something.
One glaring exception is when you commit security-sensitive information. For example, if you accidentally commit your Amazon EC2 API keys to a public GitHub repository, then adding a new commit to erase them is insufficient. Anyone could look in the commit history of the project and fetch the keys back out.
In this rare circumstance, you can roll back back the most recent commits on the local main branch with:
git reset --hard HEAD~3 # Replace '3' with the number of commits to undo
And then push those changes up to GitHub, being very explicit about forcing GitHub to update their origin/main to match your local main, even though you aren’t adding new commits:
git push origin main --force
Note that if anyone else has pulled the mistaken commit down from GitHub, they’ll still be able to view the withdrawn credentials, and they’ll now get an error when they try to pull new changes down. This is because their own git history is now incompatible with the one on GitHub. To fix this, they need to reset their main branch to overwrite their local history with GitHub’s:
git fetch origin main
git reset --hard origin/main
Needless to say, this is extremely messy, and should be avoided whenever possible.
Using .gitignore to avoid mistakes
Git has a special configuration file, .gitignore, that tells it to ignore specific files. For example, you might include a .gitignore file at the top level of the repository containing:
*.png
database_credentials.json
logs/
This will tell git to ignore all PNG files, the database credentials file, and the entire logs folder. You will never be prompted to add or commit those files, so there is no risk of accidentally pushing them to a public repository.
Rename and move files within git!
Git has poor support for moving and renaming files. When you rename a file without telling git, it compares the contents of the “new” file and the “missing” file, and if the files are identical or extremely similar, it assumes the file has simply been moved. However, if you rename a file and then make some changes to it, chances are git will no longer recognize it as the same file, and will prompt you to commit deleting the old file and creating a new file. This is inconvenient, since it destroys the history associated with the file, making it difficult to track changes. Fortunately, the solution is simple - move your files using git:
git mv oldfile newfile
This guarantees that git knows the file is renamed, and maintains history.
Conclusion
Git is a powerful tool for collaborating with others on code. It has an extraordinary breadth of functionality, because it was created by the Linux kernel developers to help them manage what is likely the single most complicated open source project in human history. However, this post covers most of the basics, and as much as I’ve needed for almost any project. I picked up git on my own, as I think many scientists do, and for several years felt like I half-understood what I was doing and stumbled my way through getting git to do what I wanted. Hopefully this can help someone in a similar place!
What is Distributed Denial of Secrets?
Posted 4/10/2022
Distributed Denial of Secrets (DDoSecrets) is a transparency collective. We’ve seen some questions and confusion recently as to what that means, so I’d like to elaborate. See also our about page, our Wikipedia page, and articles here and here.
When whistleblowers within an organization, or hackers that have gained access to files, want to get the word out, DDoSecrets can:
-
Announce the release to a wide audience
-
Check the files for personally identifying information
-
Package a release for public consumption, via torrents or web-search interfaces
-
Contact journalists at a wide range of publications
-
Collaborate with academic researchers
-
Share more sensitive documents with journalists and researchers, without making all data public
That’s our primary role: connectors and proliferators of data.
Our Sources
For most releases, a source contacts us anonymously. They describe what data they have, we have a conversation to establish veracity and the scope of documents, and negotiate a safe way to move the data to us. We typically do not know who our sources are, and do not have contact with them after they submit documents. Occasionally a source will ask to be credited publicly, in which case we verify their identity and attribute the leak to them.
We also mirror releases published by other groups. For example, ransomware groups sometimes publish their victims’ data to criminal forums when their (typically corporate) victims refuse to pay. Other criminals can then peruse the release looking for usernames and passwords, personal information, and anything else they can profit off of. By making a copy of these releases for journalists, we hope that some social good can come out of what would otherwise only benefit other bad actors.
We’ve also published datasets on behalf of other public organizations, notably including the .Win Network archive originally scraped by the Social Media Analysis Toolkit (SMAT) team, and the Patriot Front files, sourced by Unicorn Riot.
Our Publishing Process
When considering a new release, we have four main outcomes: discard the data, publish it publicly in full, publish it only to journalists and researchers, or publish a redacted subset of the documents publicly.
When we publish a release publicly, we typically release the documents via torrent, with private backups to reseed the torrents if needed. When possible, we also release documents through websites like DDoS Search, which can make data easier to browse, explore, and analyze.
When we release data with limited distribution, journalists and researchers contact us (or vice versa), and we negotiate a way to share files with them. If it’s feasible to filter out personal information, then we’ll publish the subset of low-risk documents publicly. However, given our limited staff, and the large size of many of these datasets (millions of emails and documents), we frequently mark datasets for limited distribution to vetted reserchers.
In either case, we add a detailed summary of the release to our website and usually announce publication via our newsletter, our Telegram channel, Twitter, and whatever other platforms are useful.
Working with Analysts
Usually our role ends as a publisher, but when resources permit, we also work with some journalists and academics to analyze datasets. Sometimes this aid is short-term; when our releases include content like database dumps that not all newsrooms are equipped to investigate, we’ve been able to help some news groups run a SQL query to find relevant information and export it in a simpler format like a spreadsheet.
In other cases, our collaborations have been more involved. DDoSecrets has worked on months-long investigations with:
-
The Organized Crime and Corruption Reporting Project (OCCRP) on 29Leaks
-
The University of Southern Maine and Harvard’s Institute of Quantitative Social Science, resulting in this paper so far
-
65 journalists and 20 outlets, including Forbidden Stories, on Mining Secrets
Our role in these collaborations has ranged from coordinating who’s investigating which sections of a release and collating results, to providing infrastructure (wikis for coordination, interactive sites for document search, and virtual machines for analyzing datasets), to writing our own document parsers and aiding in network analysis.
Spreading the Word
Finally, DDoSecrets aggregates investigations into our releases, summarizing and linking to articles on our newsletter and our wiki entries. Some of us interview with journalists, speak on podcasts or on television, and present at conferences about our work, and what our releases and investigations have revealed.
Support Us
If you’re a fan of what we do, please consider donating, volunteering, and helping spread information about our work. We’re a small team with limited funding, and every bit helps!
Predicting Friendships from SMS Metadata
Posted 3/30/2022
We know that metadata is incredibly revealing; given information about who you talk to, we can construct a social graph that shows which social circles you’re in and adjacent to, we can predict your politics, age, and a host of other attributes.
But how does social graph prediction work? How do you filter out noise from “real” social connections? How accurate is it, and in what cases does it make mistakes? This post introduces one approach based on the expectation-maximization algorithm, to start a discussion.
The Setup
We have texting logs from 20 individuals, showing how many times they texted every other participant over the course of a week. We have no additional data, like the timestamps of messages, length, or contents. We also won’t consider the directionality of who sent the texts, just “how many texts were sent between person 1 and 2?” Given these texting logs, we want to find the most probable friendship graph between these 20 people. We will also assume that friendships are always reciprocated, no one-way friends.
We can represent this input as a matrix, where the row and column indicate who is speaking, and the value represents number of texts:
| Person 1 | Person 2 | Person 3 | … | |
|---|---|---|---|---|
| Person 1 | 0 | 6 | 1 | |
| Person 2 | 6 | 0 | 11 | |
| Person 3 | 1 | 11 | 0 | |
| … |
It may be tempting to apply a cutoff here. For example, if person 1 and 2 text more than X times we’ll assume they’re friends. However, this doesn’t easily let us represent uncertainty: If the number of texts is close to X, how do we represent how sure we are that they might be friends? Even for values much greater or lower than X, how do we represent our confidence that we haven’t found two non-friends who text a surprising amount, or two friends who text surprisingly infrequently? Instead, we’ll use a slightly more sophisticated approach that lends itself to probability.
We will assume that friends text one another at an unknown rate, and that non-friends text one another at a lower unknown rate. This is a big assumption, and we’ll revisit it later, but for now take it as a given.
We can represent the two texting rates using Poisson distributions. This allows us to ask “what’s the probability of seeing k events (texts), given an underlying rate at which events occur?” The math for this looks like:
We can use this building block to ask a more useful question: Given that we did see k texts, is it more likely that these texts came from a distribution of friends texting, or a distribution of non-friends texting?
This is equivalent to asking “what is the probability that person A and B are friends, given the number of texts sent between them?” So, all we need to do now is run through every pair of people, and calculate the probability that they’re friends!
There’s just one problem: We have no idea what the two texting rates are. To estimate them, we’ll need to add a new level of complexity.
The Model
When determining our friends texting rate and non-friends texting rate, it would be very helpful if we knew the probability that two people are friends. For example, if 80% of all possible friendships exist, then we know most logs of texts represent the logs of friends texting, and only about the lowest 20% of text counts are likely to represent non-friends.
This sounds like it’s making things worse: now we have a third unknown variable, the likelihood of friendship, which we also don’t know the value of! In reality, it will make the problem much easier to solve.
Let’s make a second huge starting assumption: There is an equal likelihood that any two randomly chosen people in the group will be friends. This is generally not true in social graphs - highly charismatic, popular people usually have far more friends, so the probability of friendship is not at all equal - but it will make the math simpler, and it’s not a terrible assumption with only 20 people in our social graph.
We can represent this probability as follows:
To re-iterate the second line, the probability of any given friendship network F is equal to the probability of each friendship in the network existing, times the probability of each non-friendship not existing. In other words, if our friendship probability is 0.8, then about 80% of all possible friendships should exist, and if we propose a friendship network with only five friendships then the above math will tell us that the scenario is highly unlikely.
It’s important to note that this network model represents our prior assumption about the underlying friendship network, but doesn’t lock us in: given enough evidence (text messages) we will override this prior assumption, and add friendship edges even if they are unlikely under a random network.
Next, let’s approach the original problem backwards: Given a friendship network F, what’s the probability that we’d get the text logs we’ve received?
That is, for each friendship that does exist, get the probability of seeing our text observations from the friends texting distribution, and for each friendship that does not exist, get the probability of our text observations from the non-friends texting distribution. Multiply all those probabilities together, and you have the probability of seeing our full set of logs.
The Optimization
We can combine the above pieces and solve in terms of the most likely values for our friends texting rate, our non-friends texting rate, and our friendship probability. I will not include the details in this post, because it’s about five pages of calculus and partial derivatives. The high level idea is that we can take the probability of a friendship network given observed texts and parameters, and take the partial derivative with respect towards one of those parameters. We multiply this across the distribution of all possible friendship networks, weighted by the probability of each network occurring. We set the entire mess equal to zero, and solve for our parameter of interest. When the derivative of a function is zero it’s at either a local minimum or maximum, and for out-of-scope reasons we know that in this context it yields the global maximum. Ultimately, this gives us the most likely value of a parameter, given the probability that each pair of people are friends:
Where n is our number of participants, in this case 20.
But wait! Didn’t the probability that two people are friends depend on the texting rates? How can we solve for the most likely texting rate, based off of the texting rates? We’ll do it recursively:
-
Start with arbitrary guesses as to the values of our two texting rates, and the friendship probability
-
Calculate the probability that each pair of people are friends, based on our three parameters
-
Calculate the most likely values of our three parameters, given the above friendship probabilities
-
Loop between steps 2 and 3 until our three parameters converge
One quick python script to parse the log files and run our four math equations, and:
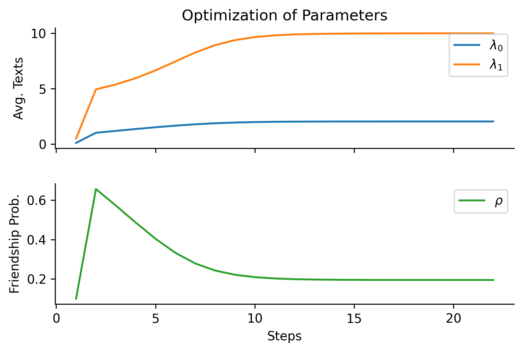
We’ve got an answer! An average of 10 texts per week among friends, 2 among non-friends, and a 20% chance that any two people will be friends. The parameters converge after only 25 steps or so, making this a quick computational optimization.
The Analysis
With our three parameters we can calculate the likelihood that any two individuals are friends based on observed texts, and plot those likelihoods graphically:
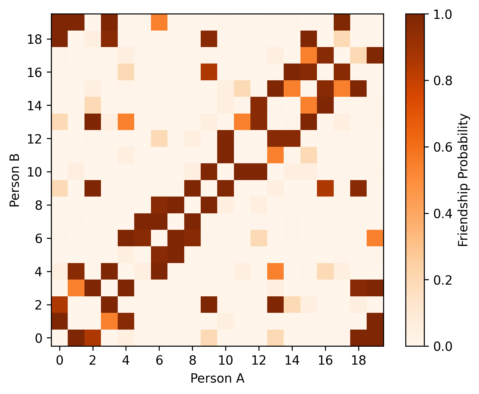
This is our “answer”, but it’s not easy to understand in current form. We’d prefer to render this as a friendship network, where nodes represent people, with an edge between every two people who are friends. How do we translate from this probability matrix to a network? Here, it’s a little more appropriate to apply cutoffs: We can plot all friendships we’re at least 70% confident exist, 90%, and 98%:
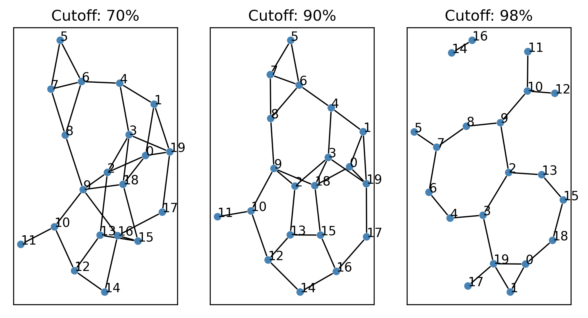
Confirmation Test: U.S. Senators
Unconvinced by the “detecting friendships from text messages” example? Let’s apply the exact same code to a similar problem with better defined ground truth: predicting the political party of senators.
We can take data on the voting records for session 1 of the 2021 U.S. Senate. For every pair of senators, we can count the number of times they voted the same way on bills (both voted “yea”, or both voted “nay”). We will assume that senators in the same political party vote the same way at one rate, and senators in different political parties vote together at a lower rate. The signal will be noisy because some senators are absent for some bills, or vote against party lines because of local state politics, occasional flickers of morality, etc.
As in the texting problem, we’ll place an edge between two senators if we believe there is a high chance they are in the same party. We can also anticipate the value of rho: Since the senate is roughly split between Democrats and Republicans, there should be close to a 50% chance that two randomly chosen senators will be in the same party. (This is an even better environment for our “random network” assumption than in the texting friendship network, since all senators will have close to the same degree)
First, the optimization:
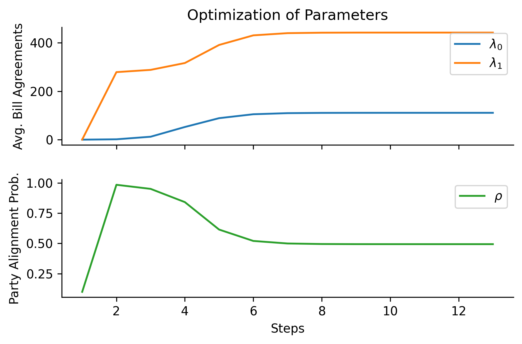
As expected, the probability of any two senators being in the same party is 0.494 - close to 50%. Members of the same party agree on bills roughly 442 times per senate session, while members of opposing parties agree roughly 111 times. And now, the resulting network:
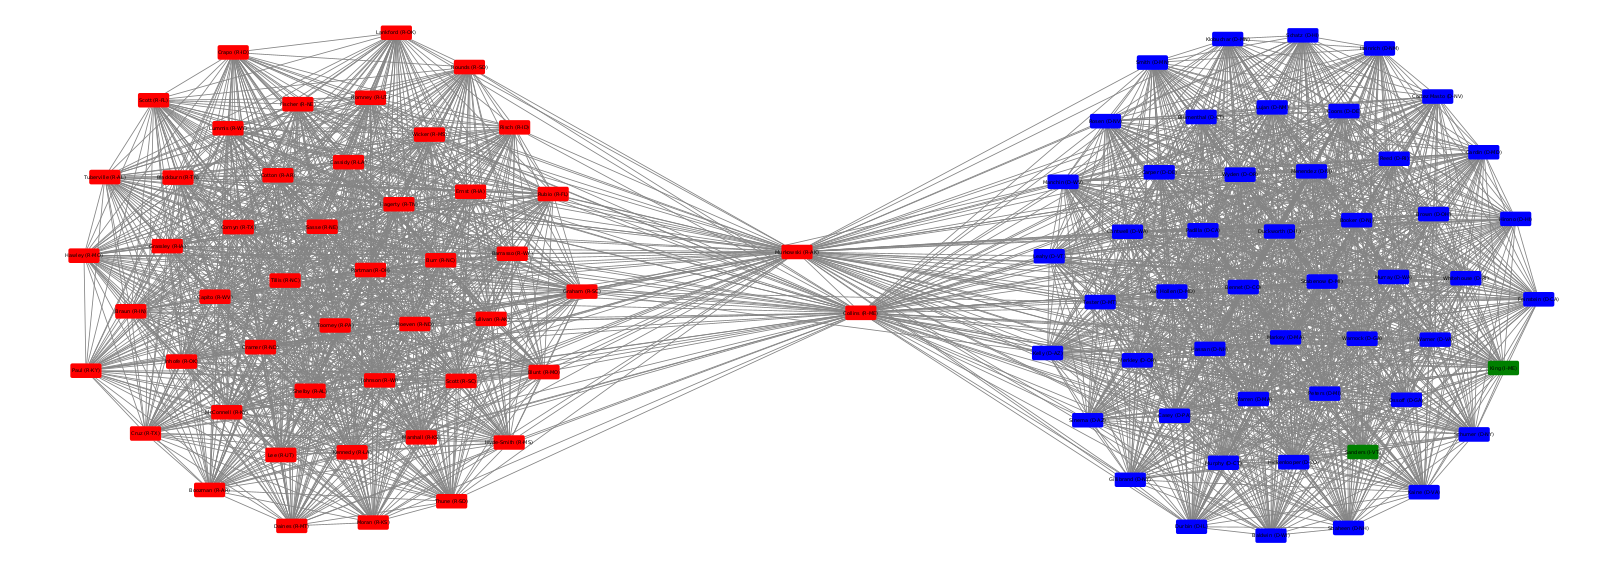
Nodes are colored according to their declared party (red for Republicans, blue for Democrats, green for independents) to confirm the network clusters we’ve found. I’ve also removed the Vice President (who only votes to break ties), and a senator that held a partial term after their predecessor resigned. Since both the Vice President and the short-term senator voted in far fewer bills than their peers, there were no edges between them and other senators.
The remaining results are accurate! Not counting the people I removed because of insufficient voting history, the algorithm struggled to classify two senators, who are shown in the center. These two senators, Collins (R-ME) and Murkowski (R-AK), are considered some of the most moderate Republicans in the senate, and are swing votes. All other senators are clearly placed in the correct cluster with their peers.
Conclusions
We’ve created a model for detecting social relationships from event data. We assume that events occur at a higher rate between people with a social relationship, and a lower rate between people without a relationship. This is general enough to describe a wide variety of scenarios.
But our model also assumes consistency: what if our assumption about two friend texting and non-friend texting rates didn’t hold? For example, in a larger social graph some people may not text much. They still text friends more often than non-friends, but both rates are much lower than their peers. Our current model would mark these less-active users as friendless, and create no edges to them. We could extend our model by switching from two global texting rates to two individual rates, but then we’d have 2N+1 variables to optimize instead of 3, and will need much more training data to optimize.
We also assumed that the underlying social network was a simple random graph: Every two members have an equal chance of being connected to one another. That assumption is appropriate for our senate network, where we’re trying to ascertain group membership. It works relatively well in the texting network because the population is very small. In many scenarios, however, we expect member degree to follow a power law, where a small number of participants are far more connected than others. We could switch our network model from random to many varieties of exponential or scale-free networks, but this will complicate the math and likely add more parameters to tune.
My main takeaway from this is the need to understand assumptions made by the model, which dictate where it can be meaningfully applied, and where it will produce deeply flawed results.
The Distributed Denial of Service at Distributed Denial of Secrets
Posted 10/9/2021
A few days ago, the Distributed Denial of Secrets website went down under a distributed denial of service attack. We set up Cloudflare and brought the site back up, but since none of us are professional sysadmins and we’re all volunteers with other time commitments, it took us a couple days to work through the steps. I thought it would be fun to walk through what happened for a less-technical audience.
The Attack
A DDoS attack consists of sending a server messages over and over again, requiring all of its resources so that it’s unable to respond to legitimate requests. Often this consists of several computers sending small HTTP requests several times a second, each of which requires that the server evaluate code and respond with a webpage. Small effort from attacker, large effort from webserver, good ratio for the attack. If a webserver is poorly configured or has limited resources, this overwhelms it and the webpage becomes unreachable until the attack is over. DDoS attacks are technically simple, and just require that you get enough participants to jam the server with a digital sit-in.
Since DDoSecrets operates on a shoestring budget (something you can help change here), the web server hosting our wiki was puny, and easily overwhelmed.
The Response
There are a few strategies for defending against DDoS attacks. You can set up intrusion detection software like fail2ban that reads your webserver logs and automatically blocks IP addresses that are sending too many requests - but if there are enough participants in the attack, the server will still get overwhelmed even as it blocks attackers left and right.
The more thorough solution is to set up a content distribution network, or CDN. Without a CDN, web requests typically work like this:
The client computer makes a DNS request for ddosecrets.com, receives back an IP address, then connects to that IP address and sends a web request.
With the addition of a CDN, the process looks more like this:
Instead of one web server, there are now many webservers in the content distribution network. When the client makes a DNS request for ddosecrets.com it receives the IP address of one of the CDN servers. Often CDN servers are spread out geographically, and the client will receive the IP of a CDN server that’s relatively close to them to improve performance. The DNS server may also alternate between returning several different IP addresses to help balance how many clients are using each CDN server.
If the client is behaving normally, then it connects to the CDN server, and sends its HTTP request there. The first time a CDN server receives an HTTP request, it connects to the real web server and forwards the request along. However, the CDN remembers what the webserver response was, and on subsequent requests for the same page, the CDN can respond with the cached answer instead of forwarding the request. This massively cuts down on how many requests the webserver receives, making the website faster even with exponentially more users, and even allows the website to remain available while the webserver is offline, so long as all the webpages can be cached. The CDN usually applies their own rate-limiting to clients, and may look for malicious patterns in requests, further limiting the possibility that malicious traffic makes it to the webserver.
So, we paid a CDN provider, set the servers up, clients should now be directed to the CDN instead of our webserver, and… nothing. The webserver continued to receive a flood of requests and remained stubbornly unresponsive. What happened?
If the attackers know the IP address of a webserver, then they don’t need to perform a DNS lookup - they can connect directly to the webserver’s IP address, and send their request. This bypasses the CDN, and all of its caching and protections. It may not even require any clever skill on the attackers’ part; since the attack began before we set up the CDN, the attackers’ computers may have simply had the IP address cached already and never needed to run a DNS lookup.
The solution to this problem is trivial: No one should be connecting to the webserver except through the CDN, so we can simply block all IP addresses at the firewall level except for IP ranges used by the CDN. Simple, but sometimes overlooked since the CDN will appear to work without this step.
DDoSecrets is back online.
Dimensional Analysis, or How I Learned to Stop Worrying and Reverse-Engineered the Bomb
Posted 10/5/2021
I’m in a Complex Systems and Data Science PhD program. In one of my classes we’ve been performing dimensional analysis, used to derive equations describing how different parts of a system relate to one another. This is a pretty empowering technique, and I wanted to walk through an example here.
The Background
G. I. Taylor was a British physicist tasked with estimating the atomic bomb’s kinetic energy during World War 2. For bureaucratic security clearance reasons he wasn’t given access to research data from the Manhattan Project, and needed to make his estimates based on declassified video footage of the Trinity bomb test. This video was sufficient to estimate the size of the mushroom cloud and the time elapsed since detonation. From this mushroom cloud footage alone, with almost no understanding of explosives or nuclear physics, we’ll try to estimate the kinetic energy of the blast.
(Details in this story are mythologized; in reality it appears that Taylor did have access to classified research data before the Trinity footage was made public, but the academic re-telling of the story usually stresses that you could derive all the necessary details from the Trinity film alone)
The Setup
We know that the size of the mushroom cloud will be related to both the energy in the bomb and the time since the explosion. Taylor assumed the density of air would also be relevant. What are those variables measured in?
-
The radius of the mushroom cloud,
r, is measured in some length units (meters, feet, etc), which we’ll refer to as[L] -
Time since explosion,
t, is measured in time units (seconds, minutes), or[T] -
The density of air,
d, is measured as “mass over volume” (like “grams per cubic centimeter”), or[M/V], but volume itself is measured as a length cubed, so we can simplify to[ML^-3] -
The kinetic energy of the blast,
E, is measured as “force across distance”, where “force” is “mass times acceleration”, and “acceleration” is “distance over time squared”. Therefore energy is measured in the dimensions[(M*L*L)/T^2], or[ML^2T^-2]
Note that the exact units don’t matter: We don’t care whether the radius is measured in meters or feet, we care that “as the energy increases, so does the radius.” If we switch from kilometers to centimeters, or switch from metric to imperial units, the scale of this relationship should stay the same.
The Derivation (The Short Way)
We want to solve for the energy of the bomb, so we’ll put energy on one side of the equation, and set it equal to our other terms, all raised to unknown exponents, times a constant. In other words, all we’re saying is “all these terms are related somehow, but we don’t know how yet.”
Now let’s write that same equation, substituting in the dimensions each term is measured in:
Now we just need to find exponents that satisfy this equation, so that all the units match. Let’s assume x1 = 1, because we want to solve for “energy”, not something like “energy squared”. This means mass is only raised to the first power on the left side of the equation. The only way to get mass to the first power on the right side of the equation is if x2 = 1. Alright, great, but that means we have length squared on the left, and length to the negative third on the right. To compensate, we’ll need to set x3 = 5. Finally, we have time to the negative two on the left, so we must set x4 = -2 on the right. Plugging these derived exponents in, we have:
Switching back from dimensions to variables, we now find:
Neat! The last difficulty is calculating the constant, which needs to be determined experimentally. That’s out of scope for this post, and for dimensional analysis, but Taylor basically estimated it based on the heat capacity ratio of air, which is related to how much pressure air exerts when heated. At the altitude of the mushroom cloud, this value is around 1.036. This constant has no units (or in other words, it’s “dimensionless”), because it’s a ratio representing a property of the air.
Using the estimates from the Trinity film (in one frame, the mushroom cloud had a radius of roughly 100 meters 0.016 seconds after the explosion, at an altitude where the density of air is about 1.1 kilograms per cubic meter), we can enter all values into our equation, and estimate that the Trinity bomb had a blast energy of 4 x 10^13 Joules, or about 10 kilotons of TNT. The established blast energy of the bomb is 18-22 kilotons of TNT, so our estimate is the right order of magnitude, which isn’t half bad for just a couple lines of math.
The Derivation (The Long Way)
We got lucky with this example, but sometimes the math isn’t as obvious. If several terms are measured in the same dimensions, then we can only find correct values for exponents by balancing the dimensions like a series of equations. Here’s the same problem, starting from our dimensions, solved with linear algebra:
Next, we transform the matrix into reduced echelon form, which makes it easier to isolate individual values:
Remember that this matrix represents three linear equations:
We can therefore see how each variable must be related:
Since we only have one independent variable (x4) we can simply set x4 = 1 and solve for the other variables. x1 = 2, x2 = -2, x3 = -10, x4 = 1.
If we had multiple independent variables (which would represent many dimensions but only a few terms), we’d have to set each independent variable to 1 one at a time, setting the other independent variables to 0, and then would need to set our partial solutions equal to one another to combine into a complete answer. Fortunately this is a simpler case!
We’ll now plug those exponents back into our dimensional equation, and painstakingly work our way back to parameters:
Certainly a longer path, but a more robust one.
The Bigger Picture
Dimensional analysis allows us to examine arbitrary systems, moving from “these different components are probably related” to “this is how different attributes of the system scale with one another”, based only on what units each component is measured in. This is an awfully powerful tool that can give us a much deeper understanding of how a system works - limited by a constant we’ll need to experimentally solve for. All we’ve left out is one of the most challenging aspects of dimensional analysis: knowing which variables are relevant to the behavior of the system. Answering this question often requires a lot of experience with the system in question, so we can best think of dimensional analysis as “taking an expert’s intuition about a system, and solving for behavior analytically.”
Communal Ownership Online
Posted 7/30/2021
We often think of online communities as a “shared digital commons”. A forum or subreddit or chatroom where people meet and talk. An open source project, where a collection of developers build something together. A wiki, where people gather and organize knowledge. These are online spaces made up by communities of people, serving those same communities. But they are rarely governed by those same communities. More specifically, the technology these platforms are built on does not support shared governance, and any community decision-making must be awkwardly superimposed. Let’s examine the problem, and what solutions might look like.
Internet platforms usually only support one of two models of resource ownership:
-
Single Administrator One user owns each GitHub repository and decides who gets commit access. If a repository is owned by an “organization”, that organization is owned by a single user who decides what users are in the org, or teams within the org, and what authority each one has. One user owns each Discord server, and each subreddit. Powers may be delegated from these “main” owners, but they hold ultimate control and cannot be overruled or removed.
-
No Administrator Platforms like Twitter or Snapchat don’t have a sense of “shared community resources”, so each post is simply owned by the user that submitted it. On platforms like IRC, there may be chat channels with no operators, where every user is on equal footing without moderation power.
The single administrator model arises by default: When someone sets up a webserver to host a website, they have total control over the server, and so are implicitly the sole administrator of the website. This made a lot of sense in the 90s and early 00s when most online communities were self-hosted websites, and the line between server administration and community moderation was often unclear. It makes less sense as “online communities” become small compartments within larger websites like Reddit, Discord, GitHub, Trello, or Wikia. There are server administrators for these sites, of course, but they’re often several levels removed from the communities hosted on them. The single administrator model makes almost no sense for peer-to-peer communities like groups on Cabal, Cwtch, or IPFS, or Freenet sites, all which have no real “server infrastructure”.
The idea of “shared ownership of an online space” is nothing new. Many subreddits are operated by several moderators with equal power, who can do anything except expel the original owner or close the subreddit. Discord server owners frequently create moderator or half-moderator roles to delegate most governance, except the election of new moderators. While technically a benevolent dictatorship, these are functionally oligarchies so long as the benevolent dictator chooses to never exercise their powers. Many prominent open source projects have a constitution or other guiding documents that define a “steering committee” or “working groups” or rough parliamentary systems for making major choices about a project’s future. Whoever controls the infrastructure of these open source projects, from their websites, to their git repositories, to chat servers or bug trackers or forums, is honor-bound to abide by the decisions of the group.
But this is exactly the problem: While we can define social processes for decision-making, elections, and delegation, we’re awkwardly implementing those social processes over technology that only understands the benevolent dictator model of “single administrator with absolute power”, and hoping everyone follows the rules. Often they do. When someone goes “power mad” in a blatant enough way, the community might fork around them, migrating to a new subreddit or discord server or git repository and replacing the malfunctioning human. However, there’s a high social cost to forking - rebuilding any infrastructure that needs to be replaced, informing the entire community about what’s going on, selecting replacement humans, and moving everyone over. Often few people migrate to a fork, and it fizzles out. Occasionally there’s disagreement over the need to fork, so the community splits, and both versions run for a time, wasting effort duplicating one another’s work. The end result is that while online benevolent dictators are ostensibly replaceable, it’s a difficult and costly process.
Wouldn’t it better if the technology itself were built to match the social decision-making processes of the group?
Let’s focus on open source as an example. Let’s say that, by social contract, there’s a committee of “core developers” for a project. A minimum of two core developers must agree on minor decisions like accepting a pull request or closing an issue, and a majority of developers must agree on major decisions like adding or removing core developers or closing the project.
Under the present model, the community votes on each of the above operations, and then a user with the authority to carry out the action acts according to the will of the group. But there’s nothing preventing a FreeBSD core developer from approving their own pull requests, ignoring the social requirement for code review. Similarly, when an npm user’s account is compromised there’s nothing preventing the rogue account from uploading an “update” containing malware to the package manager.
But what if the platform itself enforced the social bylaws? Attempting to mark a new release for upload to npm triggers an event, and two developers must hit the “confirm” button before the release is created. If there are steps like “signing the release with our private key”, it may be possible to break up that authority cryptographically with Shamir Secret Sharing so that any two core developers can reproduce the key and sign the release - but this is going too far on a tangent.
Configuring the platform to match the group requires codifying bylaws in a way the platform can understand (something I’ve written about before), and so the supported types of group decision-making will be limited by the platform. Some common desirable approaches might be:
-
Threshold approval, where 3 people from a group must approve an action
-
Percentage voting, where a minimum % of a group’s members must approve an action
-
Veto voting, where actions are held “in escrow” for a certain amount of time, then auto-approved if no one from a group has vetoed them
This last option is particularly interesting, and allows patterns like “anyone can accept a pull request, as long as no one says no within the next 24 hours”.
There’s a lot of potential depth here: instead of giving a list of users blanket commit access to an entire repository, we can implement more nuanced permissions. Maybe no users have direct commit access and all need peer approval for their pull requests. Maybe sub-repositories (or sub-folders within a repository?) are delegated to smaller working groups, which either have direct commit access to their region, or can approve pull requests within their region among themselves, without consulting the larger group.
Now a repository, or a collection of repositories under the umbrella of a single project, can be “owned” by a group in an actionable way, rather than “owned by a single person hopefully acting on behalf of the group.” Huge improvement! The last thing to resolve is how the bylaws themselves get created and evolve over time.
Bylaws Bootstrapping
The simplest way of creating digital bylaws is through a very short-lived benevolent dictator. When a project is first created, the person creating it pastes in the first set of bylaws, configuring the platform to their needs. If they’re starting the project on their own then this is natural. If they’re starting the project with a group then they should collaborate on the bylaws, but the risk of abuse at this stage is low: If the “benevolent dictator” writes bylaws the group disagrees with, then the group refuses to participate until the bylaws are rewritten, or they make their own project with different bylaws. Since the project is brand-new, the usual costs to “forking” do not apply. Once bylaws are agreed upon, the initial user is bound by them just like everyone else, and so loses their “benevolent dictator” status.
Updating community bylaws is usually described as part of the bylaws: Maybe it’s a special kind of pull request, where accepting the change requires 80% approval among core members, or any other specified threshold. Therefore, no “single administrator” is needed for updating community rules, and the entire organization can run without a benevolent dictator forever after its creation.
Limitations and Downsides
There is a possible edge case where a group gets “stuck” - maybe their bylaws require 70% of members approve any pull request, and too many of their members are inactive to reach this threshold. If they also can’t reach the thresholds for adding or expelling members, or for changing the bylaws, then the project grinds to a halt. This is an awkward state, but it replaces a similar edge case under the existing model: What if the benevolent dictator drops offline? If the user that can approve pull requests or add new approved contributors is hospitalized, or forgets their password and no longer has the email address used for password recovery, what can you do? The project is frozen, it cannot proceed without the administrator! In both unfortunate edge cases, the solution is probably “fork the repository or team, replacing the inaccessible user(s).” If anything, the bylaws model provides more options for overcoming an inactive user edge case - for example, the rules may specify “removing users requires 70% approval, or 30% approval with no veto votes for two weeks”, offering a loophole that is difficult to abuse but allows easily reconfiguring the group if something goes wrong.
One distinct advantage of the current “implicit benevolent dictator” model is the ability to follow the spirit of the law rather than the letter. For example, if a group requires total consensus for an important decision, and a single user is voting down every option because they’re not having their way, a group of humans would expel the troublemaker for their immature temper-tantrum. If the platform is ultimately controlled by a benevolent dictator, then they can act on the community’s behalf and remove the disruptive user, bylaws or no. If the platform is automated and only permits actions according to the bylaws, the group loses this flexibility. This can be defended against with planning: A group may have bylaws like “we use veto-voting for approving all pull requests and changes in membership, but we also have a percentage voting option where 80% of the group can vote to kick out any user that we decide is abusing their veto powers.” Unfortunately, groups may not always anticipate these problems before they occur, and might not have built in such fallback procedures. This can be somewhat mitigated by providing lots of example bylaws. Much like how a platform might prompt “do you want your new repository to have an MIT, BSD, or GPL license? We can paste the license file in for you right now,” we could offer “here are example bylaws for a group with code review requirements, a group with percentage agreement on decisions, and a group with veto actions. Pick one and tweak to your needs.”
The General Case
We often intend for web communities to be “community-run”, or at least, “run by a group of benevolent organizers from the group.” In reality, many are run by a single user, leaving them fragile to abuse and neglect. This post outlines an approach to make collective online ownership a reality at a platform level. This could mitigate the risk of rogue users, compromised users, and inactive moderators or administrators that have moved on from the project or platform without formally stepping down.
The Efficacy of Subreddit Bans
Posted 7/1/2021
Deplatforming is a moderation technique where high profile users or communities are banned from a platform in an effort to inhibit their behavior. It’s somewhat controversial, because while the intention is usually good (stopping the spread of white supremacy, inciting of violence, etc), the impacts aren’t well understood: do banned users or groups return under alternate names? Do they move to a new website and regroup? When they’re pushed to more obscure platforms, are they exchanging a larger audience for an echo chamber where they can more effectively radicalize the people that followed them? Further, this is only discussing the impact of deplatforming, and not whether private social media companies should have the responsibility of governing our shared social sphere in the first place.
We have partial answers to some of the above questions, like this recent study that shows that deplatformed YouTube channels that moved to alt-tech alternatives lost significant viewership. Anecdotally we know that deplatformed users sometimes try to return under new accounts, but if they regather enough of their audience then they’ll also gather enough attention from the platform to be banned again. Many finer details remain fuzzy: when a community is banned but the users in that community remain on the platform, how does their behavior change? Do some communities respond differently than others? Do some types of users within a community respond differently? If community-level bans are only sometimes effective at changing user behavior, then under what conditions are they most and least effective?
I’ve been working on a specific instance of this question with my fabulous co-authors Sam Rosenblatt, Guillermo de Anda Jáuregui, Emily Moog, Briane Paul V. Samson, Laurent Hébert-Dufresne, and Allison M. Roth. The formal academic version of our paper can be found here (it’s been accepted, but not yet formally published, so the link is to a pre-release version of the paper). This post is an informal discussion about our research containing my own views and anecdotes.
We’ve been examining the fallout from Reddit’s decision to change their content policies and ban 2000 subreddits last year for harmful speech and harassment. Historically, Reddit has strongly favored community self-governance. Each subreddit is administered by moderators: volunteer users that establish their own rules and culture within a subreddit, and ban users from the subreddit as they see fit. Moderators, in turn, rely on the users in their community to report rule-violating content and apply downvotes to bury offensive or off-topic comments and posts. Reddit rarely intervened and banned entire communities before this change in content policy.
Importantly, Reddit left all users on the platform while banning each subreddit. This makes sense from a policy perspective: How does Reddit distinguish between someone that posted a few times in a white supremacist subreddit to call everyone a racist, and someone who’s an enthusiastic participant in those spaces? It also provides us with an opportunity to watch how a large number of users responded to the removal of their communities.
The Plan
We selected 15 banned subreddits with the most users-per-day that were open for public participation at the time of the ban. (Reddit has invite-only “private subreddits”, but we can’t collect data from these, and even if we could the invite-only aspect makes them hard to compare to their public counterparts) We gathered all comments from these subreddits in the half-year before they were banned, then used those comments to identify the most active commenters during that time, as well as a random sample of participants for comparison. For each user, we downloaded all their comments from every public subreddit for two months before and after the subreddit was banned. This is our window into their before-and-after behavior.
Next, we found vocab words that make up an in-group vocabulary for the banned subreddit. Details on that in the next section. Finally, we can calculate how much more or less a user comments after the subreddit has been banned, and whether their comments contain greater or fewer percentage of words from the banned subreddit’s vernacular. By looking at this change in behavior across many users, we can start to draw generalizations about how the population of the subreddit responded. By comparing the responses to different subreddit bans, we can see some broader patterns in how subreddit bans work.
In-Group Language
We want some metric for measuring whether users from a subreddit talk about the same things now that the subreddit has been banned. Some similar studies measure things like “did the volume of hate speech go down after banning a subreddit”, using a pre-defined list of “hate words”. We want something more generalizable. As an example, did QAnon users continue using phrases specific to their conspiracy theory (like WWG1WGA - their abbreviated slogan “Where we go one, we go all”) after the QAnon subreddits were banned? Ideally, we’d like to detect these in-group terms automatically, so that we can run this analysis on large amounts of text quickly without an expert reading posts by hand to highlight frequent terms.
Here’s roughly the process we used:
-
Take the comments from the banned subreddit
-
Gather a random sample of comments from across all of Reddit during the same time frame (we used 70 million comments for our random sample)
-
Compare the two sets to find words that appear disproportionately on the banned subreddit
In theory, comparing against “Reddit as a whole during the same time period” rather than, for example, “all public domain English-language books” should not only find disproportionately frequent terms, but should filter out “Reddit-specific words” (subreddit, upvote, downvote, etc), and words related to current events unless those events are a major focus point for the banned subreddit.
There’s a lot of hand-waving between steps 2 and 3: before comparing the two sets of comments we need to apply a ton of filtering to remove punctuation, make all words singular lower-case, “stem” words (so “faster” becomes “fast”), etc. This combines variants of a word into one ‘token’ to more accurately count how many times it appears. We also filtered out comments by bots, and the top 10,000 English words, so common words can never count as in-group language even if they appear very frequently in a subreddit.
Step 3 is also more complicated than it appears: You can’t compare word frequencies directly, because words that appear once in the banned subreddit and never in the random Reddit sample would technically occur “infinitely more frequently” in the banned subreddit. We settled on a method called Jensen-Shannon Divergence, which basically compares the word frequencies from the banned subreddit text against an average of the banned subreddit’s frequencies and the random Reddit comments’ frequencies. The result is what we want - words that appear much more in the banned subreddit than on Reddit as a whole have a high score, while words that appear frequently in both or infrequently in one sample get a low score.
This method identifies “focus words” for a comunity - maybe not uniquely identifying words, but things they talk about frequently. As an example, here were some of the top vocab words from r/incels before its ban:
femoids
subhuman
blackpill
cucks
degenerate
roastie
stacy
cucked
Lovely. We’ll take the top 100 words from each banned subreddit using this approach and use that as a linguistic fingerprint. If you use lots of these words frequently, you’ve probably spent a lot of time in incel forums.
Results within a Subreddit
If a ban is effective, we expect to see users either become less active on Reddit overall, or that they’ve remained active but don’t speak the same way anymore. If we don’t see a significant change in the users’ activity or language, it suggests the ban didn’t impact them much. If users become more active or use lots more in-group language, it suggests the ban may have even backfired, radicalizing users and pushing them to become more engaged or work hard to rebuild their communities.
The following scatterplots show user reactions, on a scale from -1 to +1, with each point representing a single user. A -1 for activity means a user made 100% of their comments before the subreddit was banned, whereas +1 would mean a user made 100% of their comments after the subreddit was banned, while a score of 0 means they made as many comments before as after. Change in in-group vernacular usage is similarly scaled, from -1 (“only used vocab words before the ban”) to +1 (“only used vocab words after the ban”), with 0 again indicating no change in behavior. Since many points overlap on top of one another, distribution plots on the edges of the graph show overall trends.
The Donald
For those unfamiliar, r/the_donald was a subreddit dedicated to Donald Trump and MAGA politics, with no official connection to Trump or his team. Many vocab words were related to Republican politics (“mueller”, “illegals”, “comey”, “collusion”, “nra”, “globalist”), with a bend towards ‘edgy online communities’ (“kek”, “cucks”, etc).
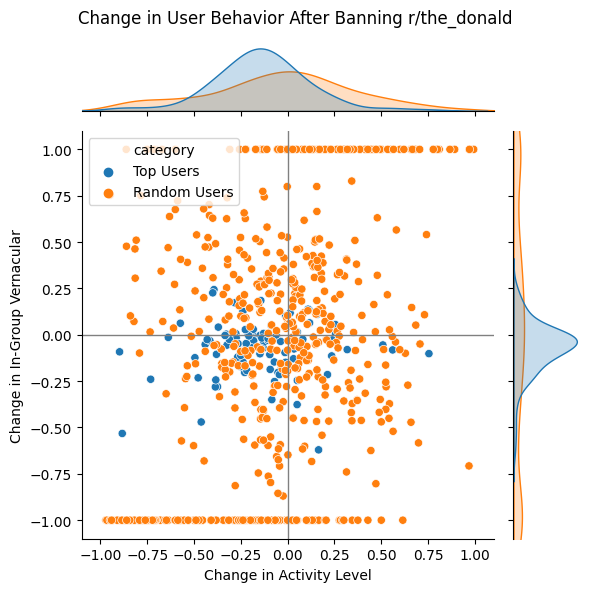
Top users from r/the_donald showed almost zero change in in-group vocabulary usage, and only a slight decrease in activity. By contrast, arbitrary users from r/the_donald were all over the place: many didn’t use much in-group vocabulary to begin with, so any increased or decreased word usage throws their behavior score wildly. Random user activity change follows a smooth normal distribution, indicating that the ban had no effect. For both top posters and random users, the ban seems to be ineffectual, but this contrasts with our next subreddit…
Gendercritical
r/gendercritical was a TERF subreddit - ostensibly feminist and a discussion space for women’s issues, but visciously anti-trans. Vocabulary includes feminist topic words (“misogyny”, “patriarchy”, “radfem”, “womanhood”), plus “transwomen”, “intersex”, a number of gendercritical-specific trans slurs, and notable mention “rowling”.
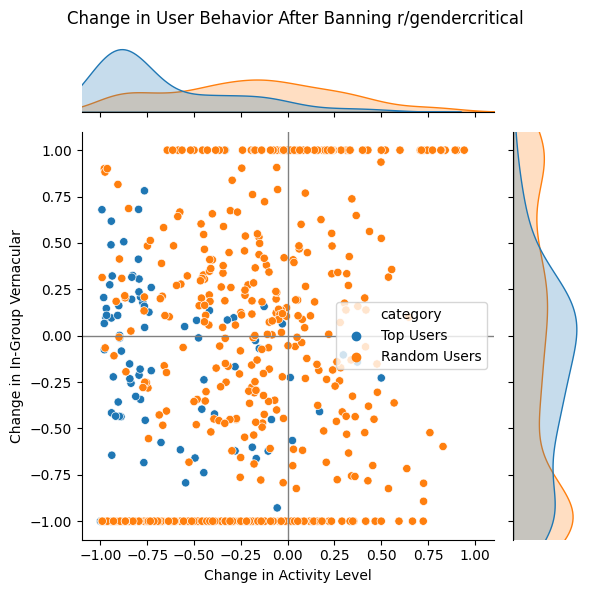
Here we see markedly different results. A large number of the top r/gendercritical users dramatically dropped in activity after the subreddit ban, or left the platform altogether. Some of those who remained stopped using gendercritical vocab words, while others ramped up vocabulary usage. Random users once again show a normal change in activity, indicating no impact, with a marked number of users that stopped all usage of gendercritical vocabulary.
Subreddit Comparison
Rather than share all 15 subreddit plots in detail (they’re in the supplemental section of the research paper if you really want to look!), here’s a summary plot, showing the median change in vocabulary and activity for top/random users from each subreddit.
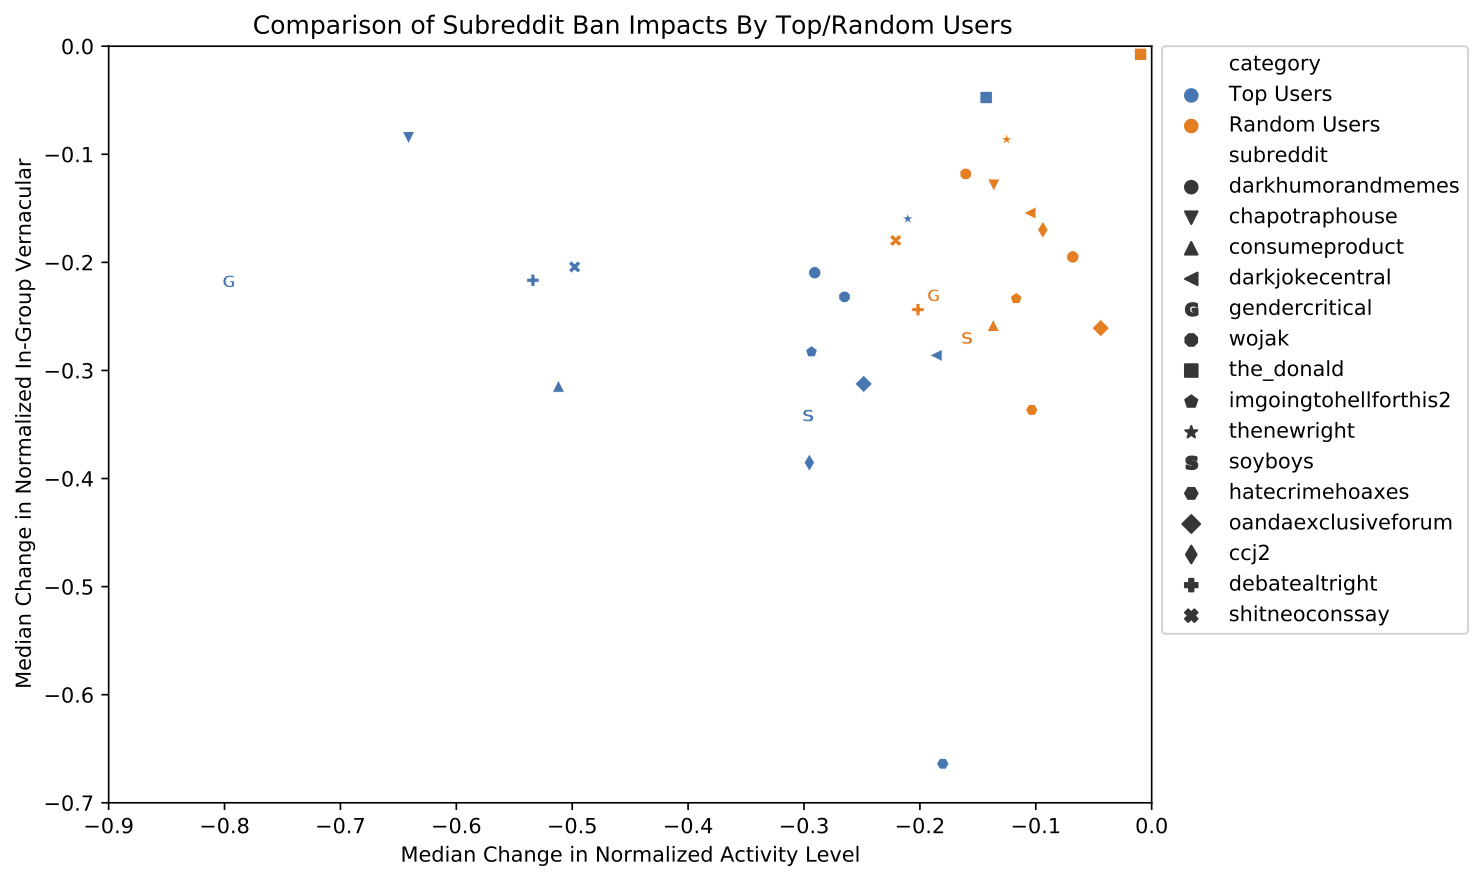
This plot indicates three things:
-
Top users always drop in activity more than random users (as a population - individual top users may not react this way)
-
While vocabulary usage decreases across both populations, top users do not consistently drop vocabulary more than random users
-
Some subreddits respond very differently to bans than others
That third point leads us to more questions: Why do some subreddits respond so differently to the same banning process than others? Is there something about the content of the subreddits? The culture?
Subreddit Categorization
In an effort to answer the above questions, we categorized subreddits based on their vocabulary and content. We drew up the following groups:
| Category | Subreddits | Description |
|---|---|---|
| Dark Jokes | darkjokecentral, darkhumorandmemes, imgoingtohellforthis2 | Edgy humor, often containing racist or other bigoted language |
| Anti Political | consumeproduct, soyboys, wojak | Believe that most activism and progressive views are performative and should be ridiculed |
| Mainstream Right Wing | the_donald, thenewright, hatecrimehoaxes | Explicitly right-wing, but clearly delineated from the next category |
| Extreme Right Wing | debatealtright, shitneoconssay | Self-identify as right-wing political extremists, openly advocate for white supremacy |
| Uncategorized | ccj2, chapotraphouse, gendercritical, oandaexclusiveforum |
(Note that the uncategorized subreddits aren’t necessarily hard to describe, but we don’t have enough similar subreddits to make any kind of generalization)
Let’s draw the same ban-response plot again, but colored by subreddit category:
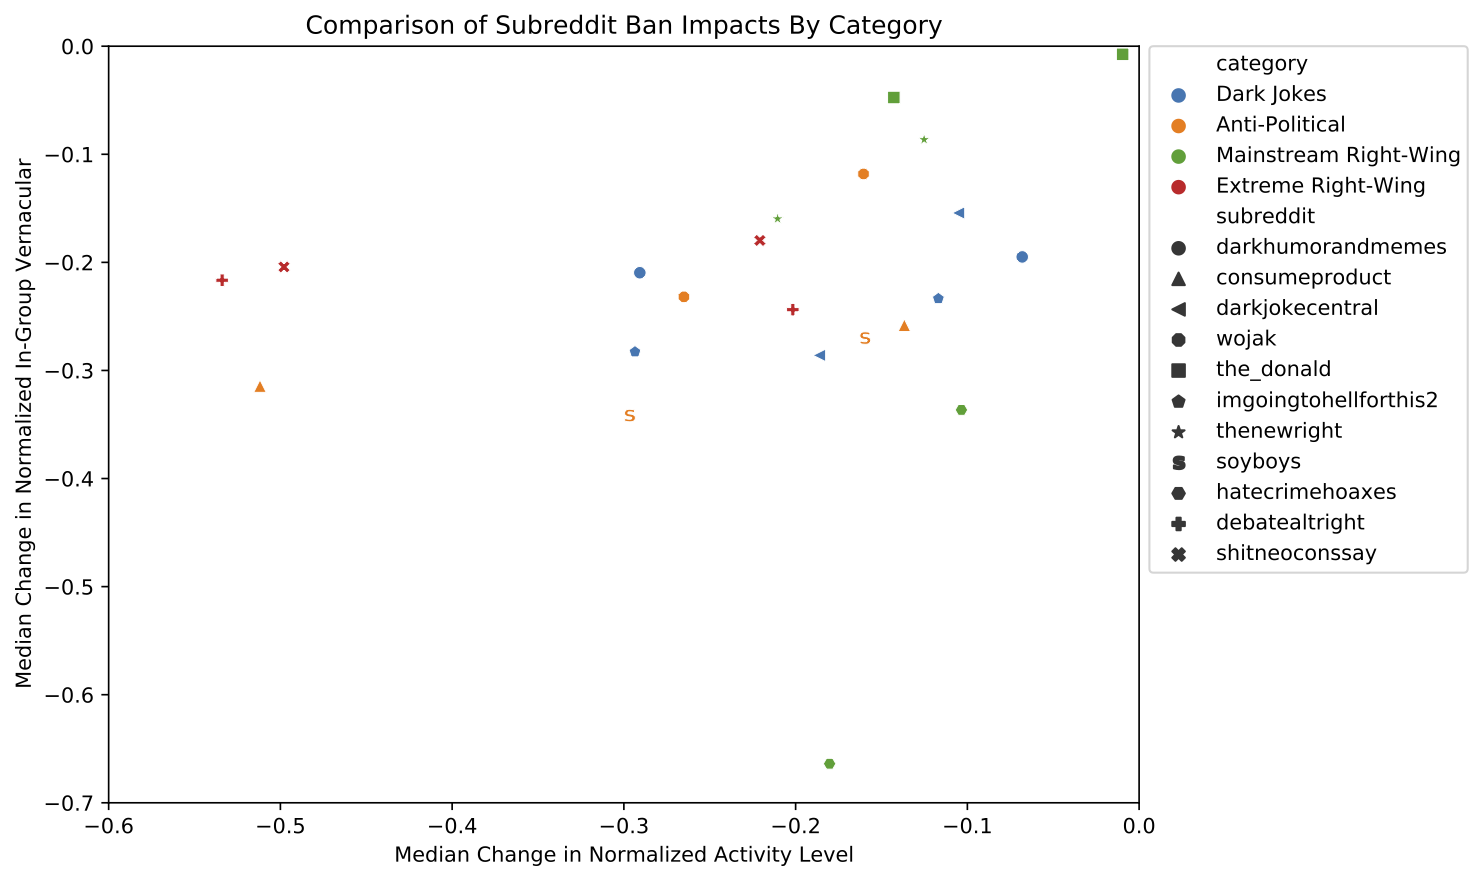
Obviously our sample size is tiny - some categories only have two subreddits in them! - so results from this plot are far from conclusive. Fortunately, all we’re trying to say here is “subreddit responses to bans aren’t entirely random, we see some evidence of a pattern where subreddits with similar content respond kinda similarly, someone should look into this further.” So what do we get out of this?
| Category | Activity Change | Vocabulary Change |
|---|---|---|
| Dark Jokes | Minimal | Minimal |
| Anti Political | Top users decrease | Top users decrease |
| Mainstream Right Wing | Minimal | Inconsistent |
| Extreme Right Wing | All decrease significantly, especially top users | Minimal |
The clearest pattern for both top and random users is that “casual racism” in dark joke subreddits is the least impacted by a subreddit ban, while right wing political extremists are the most effected.
What have we Learned?
We’ve added a little nuance to our starting question of “do subreddit bans work?” Subreddit bans make the most active users less active, and in some circumstances lead users to largely abandon the vocabulary of the banned group. Subreddit response is not uniform, and from early evidence loosely correlates with how “extreme” the subreddit content is. This could be valuable when establishing moderation policy, but it’s important to note that this research only covers the immediate fallout after a subreddit ban: How individual user behavior changes in the 60 days post-ban. Most notably, it doesn’t cover network effects within Reddit (what subreddits do users move to?) or cross-platform trends (do users from some banned subreddits migrate to alt-tech platforms, but not others?).
Tor with VPNs (Don’t!)
Posted 6/26/2021
I see a lot of questions on forums by people asking how to “use Tor with a VPN” for “added security”, and a lot of poor advice given in response. Proposals fall in two categories:
The first is useless and unnecessary, the second is catastrophically harmful. Let’s dig in.
Using a VPN to connect to Tor
In the first case, users want to connect to Tor through a VPN, with one of the following goals:
-
Add more levels of proxies between them and the ‘net for safety
-
Hide that they’re connecting to Tor from their ISP
-
Hide that they’re connecting to Tor from Tor
The first goal is theoretically an alright idea, especially if you know little about Tor’s design or haven’t thought much about your threat model. More proxies = safer, right? In practice, it doesn’t add much: any adversary able to break Tor’s three-level onion routing is probably not going to have any trouble breaking a single-hop VPN, either through legal coercion or traffic analysis. Adding a VPN here won’t hurt, but you’re losing money and slowing down your connection for a questionable improvement in “security” or “anonymity”.
The second goal is a good idea if you live in a country which forbids use of Tor - but there are better solutions here. If Tor is legal in your country, then your ISP can’t identify anything about your Tor usage besides when you were connected to Tor, and approximately how much data you moved. If Tor is not legal in your country, the Tor Project provides ‘bridges’, which are special proxies designed to hide that you are connecting to Tor. These bridges don’t stand out as much as a VPN, and don’t have any money trail tying them to you, and so are probably safer.
The last objective, hiding your IP address from Tor, is silly. Because of the onion routing design, Tor can’t see anything but your IP address and approximately how much data you’ve moved. Tor doesn’t care who you are, and can’t see what you’re doing. But sure, a VPN could hide your IP address from the Tor entry guard.
Using Tor to connect to a VPN
This is where we enter the danger zone. To explain why this is a horrible idea, we need to expand the original diagram:
When you connect to “Tor”, you aren’t connecting to a single proxy server, but to a series of three proxy servers. All of your data is encrypted in layers, like an envelope stuffed inside another envelope. When you communicate with the Tor entry guard, it can see that you’re sending encrypted data destined for a Tor relay, but doesn’t know anything else, so it removes the outermost envelope and sends the message along. When the relay receives the envelope it doesn’t know that you’re the original sender, it only knows that it received data from an entry guard, destined for an exit node. The relay strips off the outermost envelope and forwards along. The exit node receives an envelope from a relay destined for some host on the Internet, dutifully strips the envelope and sends the final data to the Internet host. When the exit node receives a response, the entire process runs in reverse, using a clever ephemeral key system, so each computer in the circuit still only knows who its two neighbors are.
The safety and anonymity in Tor comes from the fact that no server involved knows both who you are, and who you’re talking to. Each proxy server involved can see a small piece of the puzzle, but not enough to put all the details together. Compromising Tor requires either finding a critical bug in the code, or getting the entry guard, relay, and exit node to collude to identify you.
When you add a VPN after Tor, you’re wrecking Tor’s entire anonymity guarantee: The VPN can see where you’re connecting to, because it just received the data from the Tor exit node, and it knows who you are, because you’re paying the VPN provider. So now the VPN is holding all the pieces of the puzzle, and an attacker only needs to compromise that VPN to deanonymize you and see all your decrypted network traffic.
(There is one use-case for placing a proxy after Tor: If you are specifically trying to visit a website that blocks Tor exit nodes. However, this is still a compromise, sacrificing anonymity for functionality.)
What if the VPN doesn’t know who I am?
How are you pulling that off? Paying the VPN with cryptocurrency? Cool, this adds one extra financial hop, so the VPN doesn’t have your name and credit card, but it has your wallet address. If you use that wallet for any other purchases, that’s leaking information about you. If you filled that wallet through a cryptocurrency exchange, and you paid the exchange with a credit card or paypal, then they know who you are.
Even if you use a dedicated wallet just for this VPN, and filled it through mining, so there’s no trail back to you whatsoever, using the same VPN account every time you connect is assigning a unique identifier to all of your traffic, rather than mixing it together with other users like Tor does.
What if you use a new dedicated wallet to make a new VPN account every time you connect, and all those wallets are filled independently through mining so none of them can be traced back to you or each-other? Okay, this might work, but what an incredible amount of tedious effort to fix a loss in anonymity, when you could just… not use a VPN after Tor.
Tl;dr
Just don’t! Just use Tor! Or, if you’re in a region where using Tor would make you unsafe, use Tor + bridges. VPNs are ineffectual at best and harmful at worst when combined with Tor.
Reimagine the Internet Day 5: New Directions in Social Media Research
Posted 5/14/2021
This week I’m attending the Reimagine the Internet mini-conference, a small and mostly academic discussion about decentralization from a corporate controlled Internet to realize a more socially positive network. This post is a collection of my notes from the fifth day of talks, following my previous post.
Today’s final session was on new directions in (academic) social media research, and some well thought-out criticisms of the decentralization zeitgeist.
An Illustrated Field Guide to Social Media
Several researchers have been collaborating on an Illustrated Field Guide to Social Media, which categorizes social media according to user interaction dynamics as follows:
| Category | Description | Examples |
|---|---|---|
| Civic Logic | Strict speech rules, intended for discussion and civic engagement, not socialization | Parlio, Ahwaa, vTaiwan |
| Local Logic | Geo-locked discussions, often with neighborhoods or towns, often with extremely active moderation, intended for local news and requests for assistance | Nextdoor, Front Porch Forum |
| Crypto Logic | Platforms reward creators with cryptocurrency tokens for content and engagement, and often allow spending tokens to influence platform governance, under the belief that sponsorship will lead to high quality content | Steemit, DTube, Minds |
| Great Shopping Mall | Social media serving corporate interests with government oversight before users (think WeChat Pay and strong censorship), community safety concerns are government-prompted rather than userbase-driven | WeChat, Douyin |
| Russian Logic | Simultaneously “free” and “state-controlled”, stemming from a network initially built for public consumption beyond the state, then retroactively surveilled and controlled, with an added mandate of “Internet sovereignty” that demands Russian platforms supersede Western websites within the country | VKontakte |
| Creator Logic | Monetized one-to-many platforms where content creators broadcast to an audience, the platform connects audiences with creators and advertisers, and the platform dictates successful monetization parameters, while itself heavily influenced by advertisers | YouTube, TikTok, Twitch |
| Gift Logic | Collaborative efforts of love, usually non-commercial and rejecting clear boundaries of ownership, based in reciprocity, volunteerism, and feedback, such as fanfiction, some open source software development, or Wikipedia | AO3, Wikipedia |
| Chat Logic | Semi-private semi-ephemeral real-time spaces with community self-governance where small discussions take place without unobserved lurkers, like an online living room | Discord, Snapchat, iMessage |
| Alt-Tech Logic | Provides space for people and ideas outside of mainstream acceptable behavior, explicitly for far-right, nationalist, or bigoted viewpoints | Gab, Parler |
| Forum Logic | Topic-based chat with strongly defined in-group culture and practices, often featuring gatekeeping and community self-governance | Reddit, 4chan, Usenet |
| Q&A Logic | Mostly binary roles of ‘askers’ and ‘answerers’ (often with toxic relations), heavy moderation, focuses on recognition and status, but also reciprocity and benevolence | Yahoo Answers, StackOverflow, Quora |
The authors compare platforms along five axis (affordances, technology, ideology, revenue model, and governance), with numerous real-world examples of platforms in each category. The table above does not nearly do the book justice; It’s well worth a read, and I’d like to dedicate a post just to the field guide in the future.
The Limits of Imagination
Evelyn Douek, Harvard law school doctoral candidate and Berkman Klein Center affiliate, had some excellent critiques of small-scale decentralization.
Changing Perceptions on Online Free Speech
She framed online free speech perspectives as coming from three “eras”:
-
The Rights Era, where platforms are expected to be financially motivated, and will maybe engage in light censorship on those grounds (copyright, criminal content, etc), but should otherwise be as hands-off as possible
-
The Public Health Era, where platforms are expected to be stewards of public society, and should take a more active role in suppressing hatespeech, harassment, and other negative behavior
-
The Legitimacy Era, where platforms are directed by, or at least accountable to, the public rather than solely corporate interests, bringing public health interests to the forefront of moderation and platform policy
Under this framing we’re currently in the “public health era”, imagining an Internet that more closely resembles the “legitimacy era”. Reddit is expected to ban subreddits for hate speech and inciting violence, even if they don’t meet the criteria of illegal content, the public demands that Twitter and Facebook ban Donald Trump without a court order asking them to, etc. We ask major platforms to act as centralized gatekeepers and intervene in global culture. When we imagine a decentralized Internet, maybe a fediverse like Mastodon or Diaspora, we’re often motivated by distributing responsibility for moderation and content policy, increasing self-governance, and increasing diversity of content by creating spaces with differing content policies.
Will Decentralization Save Us?
Or is decentralization at odds with the public health era? This is mostly about moderation at scale. Facebook employs a small army of content moderators (often from the Philippines, often underpaid and without mental health support despite mopping up incredibly upsetting material daily), and we cannot expect small decentralized communities to replicate that volume of labor.
Does this mean that hatespeech and radicalization will thrive in decentralized spaces? Maybe, depending on the scale of the community. In very small, purposeful online spaces, like subreddits or university discord servers, the content volume is low enough to be moderated, and the appropriate subjects well-defined enough for consistent moderation. On a larger and more general-purpose network like the Mastodon fediverse this could be a serious issue.
In one very real example, Peloton, the Internet-connected stationary bike company, had to ban QAnon hashtags from their in-workout-class chat. As a fitness company, they don’t have a ton of expertise with content moderation in their social micro-community.
Content Cartels / Moderation as a Service
There’s been a push to standardize moderation across major platforms, especially related to child abuse and terrorism. This often revolves around projects like PhotoDNA, which is basically fuzzy-hashing to generate fingerprints for each image, then compare them against vast databases of fingerprints for child abuse images, missing children, terrorist recruitment videos, etc.
This is a great idea, so long as the databases are vetted so that we can be confident they are being used for their intended purpose. Finland maintains a national website blocklist for child pornography, and upon analysis, under 1% of blocked domains actually contained the alleged content.
Nevertheless, the option to centralize some or all moderation, especially in larger online platforms, is tempting. Negotiating the boundary between “we want moderation-as-a-service, to make operating a community easier”, and “we want distinct content policies in each online space, to foster diverse culture” is tricky.
Moderation Along the Stack
Moderation can occur at multiple levels, and every platform is subject to it eventually. For example, we usually describe Reddit in terms of “community self-governance” because each subreddit has volunteer moderators unaffiliated with the company that guide their own communities. When subreddit moderators are ineffectual (such as in subreddits dedicated to hatespeech), then Reddit employees intervene. However, when entire sites lack effectual moderation, such as 8chan, Bitchute, or countless other alt-tech platforms, their infrastructure providers act as moderators. This includes domain registrars, server hosting like AWS, content distribution networks like CloudFlare, and comment-hosting services like Disqus, all of whom have terminated service for customers hosting abhorrent content in the past.
All of this is important to keep in mind when we discuss issues of deplatforming or decentralization, and the idea that users may create a space “without moderation”.
Conclusion
The big takeaway from both conversations today is to look before you leap: What kind of community are you building online? What do you want user interactions and experiences to look like? What problem are you solving with decentralization?
The categories of social media outlined above, and the discussion of moderation and governance at multiple scales, with differing levels of centralization, add a rich vocabulary for discussing platform design and online community building.
This wraps up Reimagine the Internet: A satisfying conclusion to discussions on the value of small communities, diversity of culture and purpose, locality, safety, but also challenges we will face with decentralization and micro-community creation. This series provides a wealth of viewpoints from which to design or critique many aspects of sociotechnical networks, and I look forward to returning to these ideas in more technical and applied settings in the future.
Reimagine the Internet Day 4: Building Defiant Communities
Posted 5/13/2021
This week I’m attending the Reimagine the Internet mini-conference, a small and mostly academic discussion about decentralization from a corporate controlled Internet to realize a more socially positive network. This post is a collection of my notes from the fourth day of talks, following my previous post.
Today’s session was on building platforms in hostile environments, and community-building while facing censorship and dire consequences if deanonymized.
MidEast Tunes
The first speaker, Esra’a Al Shafei had spent some time building news and chat sites in Bahrain (which has a very restricted press), but quickly and repeatedly fell afoul of censorship via ISP-level domain blocking. This was before widespread use of proxies and VPNs, so even if the service could have stayed up hosted remotely, the userbase would be cut off.
Instead, she settled on a music site, sort of indie-west-african-eastern-asian-spotify, MidEast Tunes. Music streaming was harder to justify blocking than text news sites, but still provided an outlet for political speech. This grew into a collaboration system, sort of a web-based GarageBand, where users could supply samples and work together to create tracks. This spawned cross-cultural, international, feminist connections.
Ahwaa
Years later, now that proxies are prevalent and domain blocking is more challenging, she’s returned to making an LGBT+ positive forum. While the censorship evasion is easier, the site still faces many problems, from anonymity concerns to trolls.
Anonymity is secured by forbidding most/all photo posts, representing each user with a customizable but vague cartoon avatar, and providing only the broadest user profiles, like “lesbian in Saudi”.
Infiltration is discouraged through a Reddit-like karma system. Users receive upvote hearts from others for each kind message they post, and site features like chat are restricted based on total upvote hearts. In the opposite case, sufficient downvotes lead to shadowbanning. Therefore, infiltrating the platform to engage in harassment requires posting hundreds or thousands of supportive LGBT-positive messages, and harassers are automatically hidden via shadowbanning. Not a perfect system, but cuts down on the need for moderation dramatically.
Switter
The second speaker, Eliza Sorensen, co-founded Switter and Tryst, sex-worker positive alternatives to Twitter and Backpage, respectively. After FOSTA/SESTA, many US-based companies banned all sex workers or sex work-related accounts to protect themselves from legal liability. Others aggressively shadow-banned even sex-positive suggestive accounts, hiding them from feeds, search, and discovery. Not only is this censorship morally absurd in its own right, but it also took away a valuable safety tool for sex workers. Open communication allowed them to vet clients and exchange lists of trustworthy and dangerous clients, making the entire profession safer. Locking down and further-criminalizing the industry hasn’t stopped sex work, but has made it much more dangerous. Hacking//Hustling has documented just how insidious FOSTA/SESTA is, and the horrible impacts the legislation has had.
Fortunately, Australia has legalized, although heavily regulated, sex work. This makes it possible to host a sex worker-positive mastodon instance within Australia, providing a safer alternative to major platforms. This is not a “solution” by any means - FOSTA/SESTA criminalizes a wide variety of behavior (like treating anyone that knowingly provides housing to a sex worker as a “sex trafficker”), and that social safety net can’t be restored with a decentralized Twitter clone. Nevertheless, it’s a step in harm reduction.
Conclusions
Both speakers stressed the importance of small-scale, purpose-built platforms. Creating platforms for specific purposes allows more care, context-awareness, safety. Scalability is an impulse from capitalism, stressing influence and profit, and is often harmful to online communities.
This seems like a potential case for federation and protocol interoperability. Thinking especially of the Switter case, existing as a Mastodon instance means users outside of Switter can interact with users on the platform without creating a purpose-specific account there. It’s not cut off, and this helps with growth, but the community on Switter is specifically about sex work, and can best provide support and a safe environment for those users. In other cases, like Ahwaa, complete isolation seems mandatory, and reinforces context-awareness and multiple personas. Click here for my notes from day 5.
Reimagine the Internet Day 3: Adversarial Interoperability / Competitive Compatibility
Posted 5/12/2021
This week I’m attending the Reimagine the Internet mini-conference, a small and mostly academic discussion about decentralization from a corporate controlled Internet to realize a more socially positive network. This post is a collection of my notes from the third day of talks, following my previous post.
Today’s session was on platform compatibility as an alternative to regulation, and as a strategy for community bootstrapping.
Protocols, Not Platforms
Users don’t favor competition for idealized capitalistic notions of the “free market”, but out of a desire for self-determination. We generally like having choice about our own experiences; see the complaints when Twitter and Facebook switched feeds to non-chronological, complaints that Twitter doesn’t provide a feed of only people you follow without retweets and likes.
We often speak about the power of the “network effect”: I join Twitter because so many other people are on Twitter, and if you made an exact clone of Twitter’s functionality no one would move there because it lacks the compelling population. This explains why new social media behemoths are so rare, and tend to be limited to ‘one per category’, in that there’s one big Reddit-like platform, one big Twitter-like, etc.
However, even more powerful is the “switching cost”. The network effect may attract users to a new platform in the first place, but the cost of moving to a new platform, losing their social connections, conversation history, and community spaces, is what keeps them there.
The easiest way to create a new platform is therefore to interface with an older platform, lower the switching cost, and make it as easy as possible for users to migrate en-masse. Trivial examples include Telegram and Signal using phone numbers as IDs so your existing contacts immediately appear on the new platform (although this has serious privacy concerns, especially paired with notifications when an existing contact joins the platform). Jabber (now XMPP) is a more complex example: they ran a full network bridge to ICQ, AIM, and other contemporary instant messengers, allowing their users to write to their friends on all other platforms.
Maybe the best example is email, where you’re not firmly rooted to a single email server, but can export all your email, make an account on a new email server, import your mail back in, and continue writing to all the same people. Changing servers effectively changes your username, but otherwise has zero disruption to your social network.
Limits of Regulation
Legislation and regulation move at a glacial pace (see the CFAA), while technology is quickly iterated on. If we legislate social media companies, for example requiring that Facebook expose particular APIs, then they’ll work to undermine those APIs until the regulation no longer has value.
For a very real example, auto manufacturers use a standardized diagnostic port to share information with auto-mechanics. However, manufacturers started extending the protocol, making some information only accessible using custom software, so the dealership had access to more information than general mechanics. They can’t legally mandate that only the dealership be allowed to repair cars, so they made it impossibly difficult for mechanics instead. Eventually regulation caught up and required all information sent over the diagnostic port to be in plaintext via a publicly available API. So auto-manufacturers switched to sending the extra information over wireless diagnostic interfaces, bypassing the regulation.
Reverse Engineering as Praxis
Cory Doctorow suggested legalization of reverse engineering as an alternative to regulation. If mechanics could reverse engineer the secret diagnostic port protocols, then they could continue repairing cars. If the manufacturer changes the protocol in their next model of cars then they need to send updated tooling to all their own dealerships or risk disrupting their own repairs. We’d develop a cat and mouse game between mechanics and manufacturers each year, hopefully with more positive outcomes for consumers.
Returning to the broader topic of social media, we can apply the same logic to Facebook. Rather than mandate that they open APIs to the public, we would be free to reverse-engineer the Facebook mobile apps and web-interface, uncover the undocumented, proprietary APIs, and use them in third party software. This would allow the kind of content-export we’re familiar with from email, contact-syncing with other platforms, even message bridges between Facebook and other social media.
Limitations of Federation
Pivoting topics, let’s talk about some limitations of federated servers that we might link to existing networks like Facebook.
Duplication of labor is hard: if different servers have different content policies then they cannot inherit moderation decisions from one another, and must each moderate the same messages. This is especially difficult in multi-lingual scenarios, where moderators must translate and then moderate messages, and can easily miss cultural subtleties. This is less of an issue in smaller and more purpose-specific communities, which can have specifically tailored content policies with more room for context and less ambiguity.
We often frame censorship or moderation in terms of free speech, and leave out the importance of freedom of assembly. Echo chambers aren’t just where hatespeech and radicalization take place; they’re also where we organize BLM, and LGBTQ+ spaces.
Conclusion
This was a good session for broadening horizons beyond either “reign in Big Tech” or “reject Big Tech entirely and build all-new platforms”. These are good ideas for piggy-backing off of existing large networks to boot up better solutions. There’s also good perspective here on what we’re losing with decentralization. Moderation and scale are hard, and this further amplifies previous discussions on the need for a plethora of small purposeful communities over large homogeneous ones. Click here for my notes from day 3.
Reimagine the Internet Day 2: Misinformation, Disinformation, and Media Literacy in a Less-Centralized Social Media Universe
Posted 5/11/2021
This week I’m attending the Reimagine the Internet mini-conference, a small and mostly academic discussion about decentralization from a corporate controlled Internet to realize a more socially positive network. This post is a collection of my notes from the second day of talks, following my previous post.
Today’s session was mostly on cultural patterns that lead to susceptibility to misinformation and conspiratorial thinking.
Scriptural Inference
I was not raised religiously, and rarely consider religion when analyzing online communities. One of today’s speakers is an anthropologist that’s spent extensive time in southern conservative groups, which include a very high number of practicing Protestants. They drew very direct comparisons between Protestant behavior - namely personal reading, interpretation, and discussion of the Christian Bible - with conservative political practices, especially with regards to:
-
Close readings and interpretation of original documents (the constitution, federalist papers, tax law, Trump speech transcripts) over “expert contextual analysis”
-
A preference for personal research over third party expertise or authority, in almost all contexts
This aligns with constitutional literalism, a mistrust of journalists, of academics, of climate science, of mask and vaccine science, of… a lot. It’s a compelling argument. There are also very direct comparisons to conspiracy groups like QAnon, which feature slogans like “do the research.”
It’s also an uncomfortable argument, because mistrust of authority is so often a good thing. Doctors regularly misdiagnose women’s health, or people of color. There’s the Tuskegee Study. There’s an immense pattern of police violence after generations of white parents telling their children the cops are there to protect everyone. There are countless reasons to mistrust the government.
But, at the same time, expertise and experience are valuable. Doctors have spent years at medical school, lawyers at law school, scientists at academic research, and they do generally know more than you about their field. How do we reconcile a healthy mistrust of authority and embracing the value of expertise?
One of the speakers recommended that experts help the public “do their own research”. For example, doctors could give their skeptical patients a list of vocabulary terms to search for material on their doctor’s diagnosis and recommended treatment, pointing them towards reputable material and away from misinformation. I love the idea of making academia and other expert fields more publicly accessible, but making all that information interpretable without years of training, and training field experts like doctors to communicate those findings to the public, is a daunting task.
Search Engine Reinforcement
For all the discussion of “doing your own research” in the previous section, the depth of research in many of these communities is shallow, limited to “I checked the first three to five results from a Google search and treated that as consensus on the topic.”
Of course, Google results are not consensus, but are directed both by keyword choice (“illegal aliens California” and “undocumented immigrants California” return quite different results despite having nominally the same meaning), and past searches and clicks to determine “relevancy”. This works well for helping refine a search to topics you’re interested in, but also massively inflates confirmation bias.

Google knowledge graphs like the one above change a Google result from “returning documents” to “returning information”, blurring the source and legitimacy of information, and further partitioning the web into distinct information spheres, where people can easily find “facts” supporting their existing positions.
Data Voids
“Data voids” are keywords with very few or no existing search results. Because search engines will always try to find the most relevant results, even if the signal is poor, it’s relatively easy to create many documents with these “void keywords” and quickly top the search results. This makes it easy to create an artificial consensus on an obscure topic, then direct people to those keywords to “learn more”. A pretty simple propaganda technique utilizing a weakness of search engines.
Generational Differences
The speakers ended with a discussion on generational differences, especially in how media literacy is taught. Older generations had “trusted sources” that they went to for all news. Students were often told to “seek .org and .edu sites for trustworthy citations”, or before then were told that nothing on the web could be trusted, and print media and academic journals were the only reliable sources. Obviously these are all outdated notions; anyone can register a .org domain, there’s plenty of misinformation in print media, traditionally “trustworthy” sources often fall sway to stories laundered through intermediary publications until they appear legitimate. The “post-social-media youth” see all news sources as untrustworthy, emphasizing a “do your own research” mentality.
Conclusion
I really like this framing of “institutional trust” versus “personal experience and research”. It adds more nuance to misinformation than “online echo-chambers foster disinfo”, or “some communities of people are uneducated”, or “some people are racist and selectively consume media to confirm their biases.” Some people are not confident in their beliefs until they have done research for themselves, and we’ve created a search engine and echo-chamber system that makes it very easy to find reinforcing material and mistake it for consensus, and there are people maliciously taking advantage of this system to promote misinformation for their political gain. Click here for my notes from day 3.
Reimagine the Internet Day 1: Pioneering Alternative Models for Community on the Internet
Posted 5/10/2021
This week I’m attending the Reimagine the Internet mini-conference, a small and mostly academic discussion about decentralization from a corporate controlled Internet to realize a more socially positive network. This post is a collection of my notes from the first day of talks. The full recording is available on the Reimagine the Internet site.
Great summary quote from Ethan Zuckerman: “It’s not too late to fix things, but we have to stop fixing what we have now and imagine what is possible.”
What We’re Rejecting
Large scale networks usually follow one of two models:
-
Surveillance and Advertising: Social media, generally any “free” services, which sell user data to advertisers for profit
-
Transactional Sellers and Buyers: Amazon, eBay, Patreon, any service that directly sells a product, or facilitates explicit financial transactions where the platform takes a cut
Large scale networks follow these models not only because they’re financial models that can scale, but because market forces demand scale. Public for-profit corporations are by definition growth-oriented, but there are stable non-growth models outside this dichotomy.
A great example is Wikipedia: they’re donation driven, but mostly sustained by small non-ideological donations. People find Wikipedia valuable, for their homework or quick-references for questions in any context, and they’re willing to throw a few dollars the encyclopedia’s way to keep that product available to them. In this sense Wikipedia is extremely product-centric - their “growth” (mostly adding new languages and outreach in poorer, less Internet-dense countries) does not earn them profit, and is subsidized by providing a useful, slick product to their English-speaking base.
Small Communities
Facebook is ungovernable because it is not a community, it’s millions of communities bumping into each other with incompatible needs. Reaching consensus on content policy for three billion users is impossible, and a foolhardy goal.
Creating the largest community possible should rarely be the goal. Instead, we should create countless small communities, with their own content policies and standards of acceptable behavior. Users are in many such communities concurrently; we’re good at context-switching. Reddit and Discord are great examples of this: larger subreddits and discord servers are rife with abuse, but there are countless micro-communities with every imaginable focus that thrive and are generally respectful and well moderated.
Purpose-based networks are especially successful: Networks where users are all gathered for a specific shared purpose. Social networks are hard to design because many people will have diverging opinions on what constitutes “social behavior”. Wikipedia’s mission of “making an encyclopedia” is much more clear-cut. They have disagreements over policy, but everyone in the project is generally there for the same reason, and that agreement has made it easier to govern and scale.
The Fallacy of “Free and Open”
A lot of early Internet action-groups, including Wikipedia and the EFF, were based around a cyber-libertarian concept of “free and open communication”. Basically the ultimate expression of the “marketplace of ideas” - you can communicate with anyone on the Internet, regardless of race, nationality, sex, or age, because no one can see what you look like, and the Internet knows no borders. The liberatory potential of “radical openness” is outlined in the Declaration of Independence of Cyberspace and The Conscience of a Hacker (also known as The Hacker Manifesto), and is echoed in countless other messages from that era.
This vision of utopia has fallen short. Erasing race and sex and age, has (surprise surprise!) not eliminated bigotry, nor has it consistently led to a brilliant meeting of the minds. In particular, “free and open” amplifies existing power structures: the loudest, most agreed with, most online voices tend to get their way. This tends to mean mainstream communities with enough financial security to spend lots of time online.
Community Norms
Maybe one third of community behavior or less is governed by explicit rules; most behavior is governed by unstated norms of what constitutes “respect” or “acceptable behavior or content.” As an example, there’s no law preventing a student from standing in the middle of class and debating a professor over each point of their lecture, but this is generally unacceptable given the roles or student and educator, and is highly unusual.
When building platforms, we should keep in mind what rules and norms we expect our community to abide by, and design features with those norms in mind. Returning to the previous example, a web conferencing system for education may allow the lecturer to mute all students while they are presenting, requiring students to raise their hands before speaking. This reinforces social norms and makes it much more difficult to misbehave within the confines of the platform.
Reinforcing social norms goes a long way towards community self-governance, limiting the need for explicit moderation, and making a community more scalable and less chaotic and disrespectful.
Coexistence with the Corporate Net
Alternative networks are often presented in opposition to the corporate dominated “main” Internet, but this doesn’t mean that Twitter and Facebook need to burn for better communities to thrive. In fact, existing mainstream networks can be a valuable bootstrapping system to spread broad messages and find peers to join micro-communities. Alt-nets don’t need to be completely self-sustaining or discoverable at first.
Conclusion
A very exciting first day! While the talk was non-technical, I think bringing these ideas of small-scale, self-governance, norm-driven, mainstream-bootstrapping communities to peer-to-peer network design will be rewarding. Click here for my notes from day 2.
OurTube: Distributed Labor as Alternative to Advertisement
Posted 5/5/21
Social media companies, particularly YouTube, have been called out for using suggestion algorithms that lead to radicalization. The premise is that YouTube suggestions (or auto-play functionality) prompt users with increasingly extreme political content in an effort to increase engagement. The longer you stay on the platform, the more advertisements you’ll watch, the more money YouTube makes. The same premise underlies the content feeds of Facebook, Twitter, TikTok, and so on. Generally, pushing users towards neo-nazi content to maximize ad revenue is seen as a Bad Thing. The first responses are usually “we should regulate social media companies and forbid them from using auto-radicalization algorithms”, or “we should dispose of the surveillance-advertisement framework, running services like YouTube on a subscription model instead.” These are both problematic strategies, and I’ll argue that we can do better by abolishing YouTube altogether in favor of distributed hosting. Let’s jump in!
The first approach is fraught with challenges: many suggestion-feed algorithms are machine-learning black boxes, which don’t necessarily understand that they’re amplifying extreme political content, but just see correlations between keywords or specific video viewership and increased engagement. “Users that watched video X were likely to also watch video Y and therefore sit through another ad.” Legislating the computer-calibrated feed algorithms of social media companies would be an impressive feat. Even if it could be done, social media companies would be incentivized to skirt or ignore such regulations, since it’s in their financial interest to keep user engagement as high as possible. (We see a similar trend in content policies, where social media companies are incentivized to remove anything the public might see as morally objectionable, while avoiding any actions that could be perceived as political censorship. The result is censorship of LGBTQ+ and sex-positive content, and minimal intervention in white supremacist rhethoric until it crosses a clear legal line)
The second approach is more satisfying: If we pay YouTube or Facebook directly, then their financial future is secured and they no longer need advertisements. Without advertisements, they no longer need suggestion algorithms to drive up engagement. Better yet, they can take down their creepy surveillance infrastructure, since they no longer need to sell user data to advertisers to turn a profit! The viewer is now the customer rather than the product, hooray! Sort of. Putting aside whether enough users would pay to make this business model viable, it doesn’t actually solve the original issue: social media companies are still incentivized to maximize engagement, because users that regularly spend time on their platform are more likely to keep up their subscriptions. We have a similar problem if the service is “free” with micro-transactions, incentivizing addictive behavior, drawing users in until they’re willing to spend more money. Maybe the feed algorithms would get a little better, but they’d remain fundamentally the same.
But who said we have to pay for our content with money? If the core issue is “YouTube needs income from somewhere to cover their infrastructure costs”, could we instead donate our computers to serve as that infrastructure?
This could take a few forms:
-
For every video you watch, you must host that video for a time, and seed it to X other users before deleting it. This would prioritize redundancy for popular content, but gives no guarantee that obscure videos would remain available. Maybe this is a good thing? Content is “forgotten” by the network unless it’s actively viewed, or someone feels strongly that the content should remain available and explicitly chooses to host it.
-
For each video you watch, you are assigned a second video that you must host for X number of views or Y amount of time. This resolves the “no hosts for obscure content” problem at the cost of additional overhead.
Both suggested systems work similarly to current torrent technology, where peers preferentially share content with you based on your past sharing behavior. “Good citizens” who host lots of video content are able to view videos more quickly in turn, improving latency before playback, or providing sufficient bandwidth to load higher-quality versions of videos, etc. Users that host content for short periods of time, or refuse to host videos altogether, are given lower priority, and so have long video load times, especially for higher-quality versions of videos. A distributed hash table tracks what videos are currently hosted from which nodes, providing both a redundant index and redundant video storage.
From the user perspective, they’re not “paying” anything to watch YouTube videos, and there are no advertisements. If they checked, they’d see that their hard drive has lost some free space temporarily, but unless they’ve almost filled their computer, they’re unlikely to notice.
What are the limitations of this strategy? Well first, we’ve said nothing about YouTube “turning a profit”, only covering their infrastructure costs. Indeed, there’s little to no profit in this, and YouTube would become a collective public service rather than a corporation. Replacing YouTube as a company with shared volunteer labor sounds radical, but there’s precedence, in both torrenting communities and Usenet. People are generally willing to give back to the community, or at least there are enough willing people to keep the community going, especially if it costs them very little. Losing some hard drive space for a while to share that great music video you just watched is distinctly “very little effort”. OurTube :)
This leaves two large sociotechnical hurdles:
-
Unequal access. Users that live in urban areas with higher bandwidth, and can afford additional storage capacity, receive preferential treatment in a reciprocal hosting network. This is not great, but users with low bandwidth already have an inferior YouTube experience, and data storage is getting cheaper and cheaper (you can get a 1 TB hard drive for under $50 now!). At best we’re not making this problem worse.
-
Content discovery. We don’t need a recommendation algorithm to drive engagement anymore - engagement no longer brings anyone wealth - but we do need some mechanism to find videos to watch! Video titles and descriptions are searchable, but that’s easily gamed (remember early search engine optimization, websites stuffing hundreds of tiny words in the bottom of the HTML to coax search engines into increasing their relevancy scores?), and sorting search results by views doesn’t solve the problem.
I’m hopeful that the second problem could become a boon, and we could see a resurgence of curation: Users put together channels of videos by topic, amassing subscribers that enjoy the kinds of videos in the list. There could be group voting and discussion on videos, subreddits dedicated to an interest, users submitting videos and arguing over content and relevancy. The solutions seem more human than technical, and exist outside the video-hosting software itself.
A better Internet is possible, one that isn’t covered in unskippable double advertisements, doesn’t push teens towards white supremacy videos, and doesn’t have an American corporation as adjudicator over what content is morally acceptable.
Hosting Under Duress
Posted 3/26/21
I have an article in the latest issue of 2600: The Hacker Quarterly, writing on behalf of Distributed Denial of Secrets. It’s reproduced below:
Hosting Under Duress
By Milo Trujillo (illegaldaydream@ddosecrets)
On June 19th, Distributed Denial of Secrets published BlueLeaks, approximately 270 gigabytes of internal documents from U.S. local-LEA/federal-agency fusion centers, municipal police departments, police training groups, and so on. The documents have revealed a range of abuses of power, from tracking protestors and treating journalists and activists like enemies, to willful inaction against the alt-right, with additional BlueLeaks-based stories emerging each week. Thank you, Anonymous, for leaking this data!
The retaliation against DDoSecrets has been significant. Twitter promptly banned @ddosecrets, followed by Reddit’s bans of /r/ddosecrets and /r/blueleaks, all for violating content policies regarding posting personal information and hacked material. Both blocked the ddosecrets.com domain name in posts, and Twitter went as far as blocking it in DMs, and blocking URL-shortened links by following them with a web spider before approving the message. German police seized a DDoSecrets server on behalf of U.S. authorities (our hosting providers are geographically scattered), and goons from Homeland Security Investigations paid a visit to some folks operating a mirror of DDoSecrets releases, asking questions about the BlueLeaks documents and the founder of DDoSecrets, ultimately attempting to recruit them as informants and offering money for info that led to arrests.
None of these actions have hindered distribution of the BlueLeaks documents, which were released by torrent, and all are directed at the publishers of the documents, not the hackers that leaked them. Wikileaks maintains an active Twitter account and has faced no such domain banning. What we have is a warning: publishing information on U.S. law enforcement, even when clearly in the public interest, will not be tolerated.
So how do you design server infrastructure to operate in this hostile space, where third party corporations will ban you and self-hosted servers are liable to be seized? Distribution, redundancy, and misdirection. All the documents published by DDoSecrets are distributed by torrent, so there is no central server to seize or account to ban to halt distribution, and data proliferates so long as there is public interest. But leaking data is only half of the DDoSecrets mission statement: raw documents aren’t valuable to the public, the ability to extract meaning from them is. Therefore, DDoSecrets works closely with journalists and academics to help them access and analyze data, and runs a number of services to make analyzing leaks easier, like Whispers (https://whispers.ddosecrets.com/), a search tool for Nazi chat logs, or X-Ray (https://xray.ddosecrets.com/), a crowd-sourced transcription tool for leaked business records with formats too challenging to OCR. These services have to be hosted somewhere.
Static services like Whispers or the homepage are easy: They’re set up with backups and Docker containers and Ansible scripts. If a server disappears, rent a new one from a different hosting provider and re-deploy with a couple lines in a terminal. A few services aren’t quite so easy to replicate, though. The Data server maintains a copy of every leak, available over direct HTTPS, mostly so we can give a URL to less technical journalists that “just works” in their browser, without walking them through using a torrent client. All the data is available by torrent and nothing unique is on the server, but finding a new hosting provider to spin up a 16-terabyte system (not counting redundant drives in the RAID) and then re-uploading all that data is, to say the least, inconvenient. The same goes for Hunter, the document-ingesting cross-analyzing leak search engine. It would be nice if we only had to migrate these servers infrequently.
The solution for these large servers is to hide them away forever, and make a repeat of the German seizure unlikely. These servers are now hosted only as Tor onion sites, and are only connected to, even for administration, via Tor. A tiny “frontend” virtual machine acts as a reverse-proxy, providing a public-facing “data.ddosecrets.com” that really connects via Tor to the much larger system. The reverse-proxy can be replaced in minutes, and doesn’t know anything about the source of the data it’s providing.
We’ll end with a call to action. None of the design outlined above is terribly complex, and with the exception of the Tor reverse-proxy, is pretty common IT practice in mid-sized companies that have outgrown “a single production server” and want scalable and replaceable infrastructure. The technical barrier for aiding the cause is low. Hacking has always been about challenging authority and authoritarianism, and that mindset is needed now in abundance, at DDoSecrets and beyond. No time to waste - Hack the Planet!
I submitted the article on January 3rd, so it predates a range of DDoSecrets releases including the Parler Scrape and the Gab Leak, which have drawn more data, attention, and significant operating costs to the collective. It also predates the Verkada hack and subsequent raid on Tillie Kottmann’s apartment, which culminated in charges that should frighten anyone connected to computer security in any form (Twitter thread).
We’ve seen this dynamic play out before, when hacktivist groups in 2010-2012 challenged corporations, governments, and psuedo-religious cults in a bid to make the world a better place. Emma Best has written an article on Hacktivism, Leaktivism, and the Future exploring these parallels, some of what we can expect from both hacktivism and State response going forward, and hopeful futures of what we can accomplish together.
If you believe in what we are doing, your help, either financial or by volunteering, would be greatly appreciated.
Color Filter Array Forensics
Posted 2/1/21
Digital Image Forensics is a field concerned with identifying whether images are original or have been edited, and if the latter, what kinds of edits have been made. I haven’t experimented much with digital forensics, but there’s overlap with steganography and neat encoding tricks like halftone QR codes. I’ve been reading about some forensic techniques in UC Berkeley’s “Tutorial on Digital Image Forensics” (200 page PDF), and Color Filter Array forensics is a fun one.
Digital cameras have hardware limitations that leave very specific patterns in the resulting images, and any photo edits will disrupt these patterns, unless the editor takes care to preserve them. Details follow.
Digital Camera Hardware
Digital images usually consist of three color values per pixel, for red, green, and blue. However, most digital cameras don’t have any color sensors in them. Instead, they have a grid of light/luminosity sensors, and they add a layer of filters in front of the sensors that filter out all but red, all but green, or all but blue light. This is much cheaper to manufacture! But there’s a serious drawback: Each pixel can only record a single red, green, or blue sample, instead of all three.
So cameras fake their color data! They use a light filter grid called a Color Filter Array (most commonly a Bayer Filter), like the following:
One row consists of red/green/red filters, the following row consists of green/blue/green filters, then red/green/red, and so on. The result is that each pixel now has a real value for one color channel, and has two or more neighbors with a real value for each other color channel. We can approximate the missing color channels as an average of our neighbors’ color channels. For example, a red pixel will calculate its “blue” channel as the average of the neighbors in the four corners diagonal from its position, and will calculate its “green” channel as the average of the neighbors above, below, left, and right. This approximation is called a “de-mosaicking” algorithm.
De-mosaicking works okay, because how much will the red value change over the distance of a single pixel? Usually not by very much, unless there’s a sharp edge with high color contrast, in which case this approximation will make colors “bleed” slightly over the sharp edge. Newer cameras try to auto-detect these high-contrast borders and only approximate color channels using the neighbors on the same side of the border, but let’s ignore that for now.
Detecting De-Mosaicking Patterns
While the simulated color data looks mostly correct to the human eye, it leaves an unnatural pattern in the numeric color values for each channel. Specifically, we know that each pixel will have two “simulated” channels that are the average of the same channel in each neighboring pixel with a real value for that channel. This should be easy to check in Python, Matlab, or your image-analysis language of choice:
#!/usr/bin/env python3
from PIL import Image
import numpy as np
from statistics import mean

im = Image.open("bayer_filter_demosaicked.jpg")
pixels = np.array(im)
RED,GREEN,BLUE = [0,1,2]

# .X.
# ...
# .X.
def getVerticalAverage(pixels, i, j, channel):
        rows = pixels.shape[0]
        if( i == 0 ):
                return pixels[i+1,j,channel]
        if( i == rows-1 ):
                return pixels[i-1,j,channel]
        return round(mean([pixels[i-1,j,channel],pixels[i+1,j,channel]]))

# ...
# X.X
# ...
def getHorizontalAverage(pixels, i, j, channel):
        cols = pixels.shape[1]
        if( j == 0 ):
                return pixels[i,j+1,channel]
        if( j == cols-1 ):
                return pixels[i,j-1,channel]
        return round(mean([pixels[i,j-1,channel],pixels[i,j+1,channel]]))

# X.X
# ...
# X.X
def getDiagonalAverage(pixels, i, j, channel):
        rows = pixels.shape[0]
        cols = pixels.shape[1]
        corners = []
        if( i > 0 ):
                if( j > 0 ):
                        corners.append(pixels[i-1,j-1,channel])
                if( j < cols-1 ):
                        corners.append(pixels[i-1,j+1,channel])
        if( i < rows-1 ):
                if( j > 0 ):
                        corners.append(pixels[i+1,j-1,channel])
                if( j < cols-1 ):
                        corners.append(pixels[i+1,j+1,channel])
        return round(mean(corners))

def confirmEqual(i, j, color1, color2):
        if( color1 != color2 ):
                print("Anomaly detected at %d,%d (got %d, expected %d)" % (i,j, color1,color2))

# For every pixel, determine what 'real' color channel it has
# then confirm that its interpolated channels match what we get
# from de-mosaicking
for i,row in enumerate(pixels):
        for j,col in enumerate(row):
                if( i % 2 == 0 ): # Red/Green row
                        if( j % 2 == 0 ): # Red column
                                correctGreen = mean([getHorizontalAverage(pixels,i,j,GREEN),getVerticalAverage(pixels,i,j,GREEN)])
                                correctBlue = getDiagonalAverage(pixels,i,j,BLUE)
                                confirmEqual(i, j, pixels[i,j,GREEN], correctGreen)
                                confirmEqual(i, j, pixels[i,j,BLUE], correctBlue)
                        else: # Green column
                                confirmEqual(i, j, pixels[i,j,RED], getHorizontalAverage(pixels,i,j,RED))
                                confirmEqual(i, j, pixels[i,j,BLUE], getVerticalAverage(pixels,i,j,BLUE))
                else: # Green/Blue row
                        if( j % 2 == 0 ): # Green column
                                confirmEqual(i, j, pixels[i,j,RED], getVerticalAverage(pixels,i,j,RED))
                                confirmEqual(i, j, pixels[i,j,BLUE], getHorizontalAverage(pixels,i,j,BLUE))
                        else: # Blue column
                                correctGreen = mean([getHorizontalAverage(pixels,i,j,GREEN),getVerticalAverage(pixels,i,j,GREEN)])
                                correctRed = getDiagonalAverage(pixels,i,j,RED)
                                confirmEqual(i, j, pixels[i,j,RED], correctRed)
                                confirmEqual(i, j, pixels[i,j,GREEN], correctGreen)
Of course, this is only possible if you know both which Color Filter Array the camera model that took the photo uses, and the details of their de-mosaicking algorithm. For now we’ll assume the basic case of “red/green + green/blue” and “average neighboring color channels ignoring high-contrast borders”. For more on color filter arrays and better de-mosaicking approaches, read here. Let’s also assume the image has only lossless compression, which is often the case for the highest export quality straight off a digital camera.
Image Editing Footprints
If anyone opens our camera’s photos in editing software like Photoshop or GIMP, and makes any color adjustments, they’ll break the de-mosaic pattern. If they use the clone/stamp tool, the stamped portions of the image won’t have color channels averaging their neighbors outside the stamped region, and the de-mosaic pattern will be broken. If they copy a portion of a different image into this one, the pattern will be broken.
Not only can we detect when an image has been altered in this way, we can detect where anomalies occur, and potentially highlight the exact changes made. Amending the above script, we’ll replace “reporting” an anomaly with highlighting anomalies:
# Turn all correct pixels 'red', leaving anomalies for further examination
pixels2 = np.copy(pixels)
def confirmEqual(i, j, color1, color2):
        global pixels2
        if( color1 == color2 ):
                pixels2[i,j,RED] = 255
                pixels2[i,j,GREEN] = 0
                pixels2[i,j,BLUE] = 0
Since Photoshop/GIMP’s changes look “correct” to the human eye, the tools have done their job, and they have no incentive to make their changes undetectable to forensic analysis.
Defeating CFA Anomaly Detection
Unfortunately, this technique is far from flawless. There are two ways to defeat CFA anomaly detection:
-
Delete the appropriate RGB channels from each pixel after editing the image, and re-run the de-mosaicking algorithm to recreate the de-mosaic pattern. This requires the forger have the same knowledge as a forensic analyst regarding exactly what Color Filter Array and de-mosaicking approach their camera uses.
-
Export the image using a LOSSY compression algorithm, with the compression rate turned up high enough to perturb the channel values and destroy the de-mosaic pattern. This will make it obvious that the image has been re-saved since being exported from the camera, but will destroy the clear-cut evidence of which portions have been edited, if any.
All in all, a very cool forensic technique, and a fun introduction to the field!
Peer-to-Peer Network Models and their Implications
Posted 11/21/20
Let’s take the following as a given:
Mainstream social media is harmful because it puts a single company in control of the human social experience and places them in the role of cultural censor
If you agree and want to get on with addressing the problem, skip ahead to the next section.
How We Got Here
When we say “control of the human social experience” we refer to something like Elinor Ostrom’s Institutional Analysis and Development Framework (here’s a good paper on applying IAD to digital institutions if you want to dive in), which describes platforms in terms of the following rules:
-
Operational Rules: Describe the interface and what actions a user can take, such as tweeting and retweeting and liking
-
Collective Rules: Describe the higher-level context in which the operational rules are utilized, like how the Twitter content feed orders tweets based on what users you follow, how popular the tweet was in terms of retweets and likes, and how old the content is
-
Constitutional Rules: Describe by what process the operational, collective, and constitutional rules can be changed
In a corporate-owned social media network, the corporation has complete control over the operational and collective rules, and most of the control over the constitutional rules. There may be some external influence, such as summoning the CEOs in front of Congress for questioning, or threatening to amend FCC regulations governing Internet platforms, or DMCA takedown requests. Regardless, the users of the platform, those most affected by operational and collective rules, have almost no say over those rules.
The only influence a user has over a platform is the option to leave, which en masse might impact the company’s bottom line. However, if we assume users on social media generally want to be social, then they’ll want to migrate to another social platform when they leave, and all the major social media companies have similarly tight control over their platforms with remarkably similar acceptable content and moderation policies.
When we describe platforms as cultural censors, we mean that they decide what content they will permit on their platform and what is a banable offense. Across social sites like Tumblr and Facebook and infrastructure sites like Paypal and Patreon, we’ve repeatedly seen companies take a puritanical stance against LGBT+, sex-positive, and sex-work content. Violet Blue (fantastic!) has written lots about this. Simultaneously, platforms are extremely hesitant to censor white supremacist or neo-nazi content, because they do not want to be accused of political censorship or bias by Congress or the White House, and the aforementioned content is increasing adjacent to Republican political talking points.
So, corporate-run social media implies a structure the users have no say in, with content limits the users have no say in, which favor harmful and icky views while inhibiting freedom of expression. There’s no way out by hopping to another corporate-run social media platform, because the next platform has the same problems and policies. “I’ll just build my own platform” leads to the same pattern with a different set of oligarchs, as we’ve seen (and I’ve written about before) with a range of “alt-tech” platforms like Voat, Parler, Gab, and BitChute that were created to host right-wing extremist content banned from their mainstream counterparts.
Decentralizing Governance
To address this problem we need a radical new kind of social media, with no central governors. This new media should not be susceptible to a small oligarchy enforcing social views, but ideally should have some conception of moderation, so community spaces can remove harassers, abusers, spammers, and hateful content.
The clear solution is a decentralized network, where content isn’t hosted on a single server hosted by a single entity. There can be collective storage of social media data, with collective agreement on what content to support and how.
Okay, great! So what does “decentralized” look like? A distributed hash table? A blockchain? A bunch of mirrored servers? Let’s look before we leap and consider common decentralized network models and their implications when used in social media of any sort.
Distributed Hash Tables
I recently described distributed hash tables in more depth, but the one line summary is that in a DHT users are connected directly to multiple peers, and data in the form of key-value pairs (like a Python dictionary) are distributed across all peers with some redundancy, so anyone can quickly look up information associated with a known key. Participants use a centralized introduction server (called a “tracker” for torrents) to find their initial peers, but this introduction point has little information and can be easily replaced or made redundant.
DHTs have two significant limitations. The first is that all content must be framed as a key-value pair, and it’s not always obvious how to design systems around this constraint. Nevertheless, a variety of projects use DHTs at their core, including Hyperswarm, the underlying peer-discovery system used by Hypercore (previously known as “DAT protocol”), which in turn is the peer-to-peer content sharing system powering chat applications like Cabal. DHTs are also at the heart of GNUnet (another generic p2p content sharing system used for file-sharing and chat), and a similar key-value routing technology is used in Freenet, which is aimed at distributed file hosting, microblogging, version-control systems, and other append-only shared data. Finally, DHTs are used for routing in the Invisible Internet Project, and for connecting to onion services in Tor, so it’s safe to say that DHTs are a common design pattern in decentralized spaces.
The larger limitation of DHTs is that they produce a singleton. While a distributed hash table is “distributed” in the sense that content can be scattered across a wide range of peers, it is centralized in the sense that there is only a single DHT network shared by all users, with a single shared namespace, storing content for all peers in the network. This may not always be desirable: users may not want to host content for peers outside their social circle, may not want to reveal their IP address to peers outside their circle, or may simply want to extend the DHT and change its functionality in a way incompatible with the larger community. While it is technically possible to run multiple competing DHTs with no connection to one another, utilizing separate introduction servers, this is strongly disincentivized, since DHTs gain performance, redundancy, reliability, and storage capacity with scale.
Blockchains (Sigh)
Blockchains are a form of data storage with two interesting attributes:
-
They form an append-only log that cannot be rewritten (once a block has proliferated and several more blocks are added to “solidify” its presence in the chain)
-
They are highly redundant
If those two attributes are not both valuable for your application, then a blockchain is the wrong choice for you. There are alternative solutions to append-only logs (like signed messages stored in a merkle tree, or Paxos), and to data redundancy (like a DHT, or client-stored messages that can be re-uploaded to peers later, as in sneakernets). But let’s look at the structure of a blockchain network.
Blockchain network traffic looks remarkably similar to DHT traffic, except that instead of using key-value pairs, every peer stores the complete data log:
This certainly provides more redundancy than a DHT, and maybe that level of redundancy is important if you’re building a ledger of all financial transactions ever and your entire economy relies on its stability. For most use-cases, the redundancy afforded by a DHT is sufficient, and requires far less storage for each peer. Blockchains also imply a significant computational cost to write any new data if the blockchain uses proof-of-work to ensure immutability. It’s an expensive and over-applied data structure.
We can address some of the limitations of blockchain using a sidechain, where the primary blockchain (or another data structure like a merkle tree) includes references to the heads of miniature blockchains that are smaller and can be updated more quickly. These sidechains can follow simpler rules than a public blockchain, such as allowing a user with a private key to craft new blocks instead of using a “proof of work” algorithm.
Signal, the centralized but end-to-end encrypted chat software, uses a chat protocol with some similarities to a blockchain. In the Signal protocol, each message in a conversation includes a reference to both the previous message that user sent, and the most recent messages that user has seen. This means Signal’s central server can’t ommit messages without clients noticing, and at worst can deny all service to a user. However, there is no proof-of-work involved in this chain; the only requirement for adding a new block is that it must be signed by the user, eliminating one of the largest limitations of a full blockchain.
Sidechains are also at the heart of Keybase, a Slack-like encrypted messaging and file hosting system that maintains a chain for each user to immutably store information about the user’s identity. Keybase also maintains each shared folder as a blockchain of write operations. Notably, however, Keybase is a centralized system that uses blockchains and signature verification to keep the server honest. The blockchains serve as a tamper-evidence mechanism that makes it difficult for the server to revert or manipulate messages (along with aggressive client caching), but the Keybase server is a sole central data repository for the network.
As with DHTs, blockchain networks form singletons (even if not run on a central server like Keybase), and running parallel blockchains or forking a chain is frowned upon because it shrinks the network and dilutes the benefit of a single shared ground truth.
Federation
Federation is an interesting combination of centralization and decentralization. From the user’s perspective, federated social networks work much like mainstream networks, except that they have several Facebook- or Twitter-like servers to choose from. Each server operates as an independent miniature social community. Server operators, however, have a different experience. Each operator can choose to federate with another server, bidirectionally linking the two servers, exchanging messages to create a larger collaborative social network. Collections of federated servers are referred to as a fediverse.
The most well-known federated social network is Mastodon, a Twitter-like cluster of servers. Each server has its own content policies and moderators, and usually only federates with servers with similar content policies. This lessens the likelihood of the network implementing extremely puritanical social policies, and allows easy migration if moderators on a single server go power-mad. When Gab (an alt-right Twitter clone) abandoned their own software stack and became a Mastodon instance they were universally condemned, and most other server operators refused to federate with the Gab instance, isolating them on their own server and proving the effectiveness of Mastodon’s moderation strategy.
Unfortunately, Mastodon also suffers from the singleton problem. While servers can federate, it is difficult to convince an operator of a major server to create a bidirectional link with a minor one, and there is little incentive to run a Mastodon server and less incentive if it is unfederated with major servers. As a result, three Mastodon servers contain almost 60% of the known Mastodon population.
The Diaspora Network, a decentralized Facebook-like network, also follows a federation model. Of note, they popularized clustering contacts by “aspects” of your life, so you can easily share contact with some categories of peers and not others.
It’s worth pointing out that federation is far from a new concept. Internet Relay Chat also provides functionality for federating servers, synchronizing chatrooms and messages between two servers, though the process is very rarely used since it grants operators on both servers extreme power over conversations that occur on the other. Similarly, NNTP (the network news transfer protocol underlying Usenet) allows servers to exchange news postings and comments to create a shared community. In Usenet’s case federation was commonplace, and resulted in a singleton network similar to Reddit with far less moderation.
Pubs
Pubs (in the “public house”, inn/bar sense of the word) invert the idea of federation. Instead of users connecting to a single server and allowing the servers to interlink, users now connect to several servers, and serve as the links. In a pub model, servers are reduced to the role of content caches and introduction points: They allow users to leave messages for other users to find, allowing two participants to communicate asynchronously without being online at the same time for a peer-to-peer connection. They also allow users to leave messages publicly on the server, making it possible to introduce themselves and meet other users.
Since users are connected to multiple servers at once, they can post the same message to multiple servers concurrently, and rely on clients to recognize and combine the duplicates. This means users are not bound to a single server where they host their content, as in a federated service, but can store their content feed on multiple servers, more akin to a distributed hash table. Since servers have no federation, there is little cost to running a pub server. Unlike in federated spaces, a small pub can be valuable by providing a closed but shared conversation space, representing a tighter group of friends, or colleagues with a similar and obscure interest. Users can choose to only post some of their messages to these private spaces, moving between more public and more private content feeds.
The most popular pub-model network in use today is Secure Scuttlebutt, which works both via pub servers and via syncing with peers over WiFi networks, exchanging both their own messages and cached messages from friends and friends-of-friends (gossip). Notably, Scuttlebutt is offline-first: the entire “content feed” is stored locally, so you can browse and reply to messages while offline, and then re-sync when you next connect to a pub or are on a LAN with another peer. The entire network can theoretically run without pubs, purely on local network exchanges, and place no authority on pubs at all. Without a reliance on central servers there is also no clear opportunity for community moderation. Scuttlebutt supports a peer blocking individual users and hiding them from their content feed, but this scales poorly on a larger network.
The Open Privacy Research Society is working on their own pub-based chat network, Cwtch, with the twist that pubs can’t read the messages they host. Cwtch is more like a signal group chat, sans the reliance on the central Signal servers, by caching messages in a variety of servers and storing them locally. Cwtch operates entirely over Tor, reaching pubs and other peers via Tor onion services. When two peers are online at the same time they can exchange their message logs from the group, filling in each-other’s blanks, and using a server only to leave messages asynchronously when peers are offline.
Pub-style networks have the distinct advantage of only caching content relevant to the user (or close to them in a social graph). Servers need to store considerably more content, but can auto-delete older messages to limit the load, since messages will live on in users’ local storage.
The Takeaways
DHTs, Blockchains, Federation, and Pubs provide distinctly anti-capitalist models for sharing social content without a patron corporation facilitating discussion. Each decentralized model has unique characteristics shaping the kinds of information sharing that are possible, the opportunity (and dangers) for moderation, and the kind of clustering that is likely to result. I’m personally most excited about pubs, while acknowledging the utility of DHT networks, but all four paradigms have borne fruit already and should be pursued.
The folks at SimplySecure (plus some community members like me!) are exploring decentralized design concepts at decentralization off the shelf.
RAIDs: Combining Hard Drives for Fun and Profit
Posted 10/22/20
After writing about decentralized data storage and torrents, I’ve had data storage on my mind. I drafted this post while setting up a RAID for the MeLa research group today, and built RAIDs for DDoSecrets a few weeks ago, so there’s a ton of “data storage” in my life right now and it only seems natural to quickly write up how large data storage on a centralized server works.
Hard drives get more expensive as storage capacity increases, and traditional spinning-plate hard drives have a limited lifespan, because spinning pieces and motors wear out relatively quickly from friction. Hard drives can read and write data more quickly when they spin faster, but this also wears out the drive more quickly. Therefore, getting a very big hard drive with a long lifespan that’s also fast becomes prohibitively expensive.
What if instead we could slap together several cheap and unreliable hard drives, and out of the harmony of garbage get high-capacity, reliable, high-speed data storage? A Redundant Array of Inexpensive Disks, or RAID, does exactly this. But how?
Types of RAIDs used today
Linear RAID
The most obvious way to “combine” two hard drives is to (metaphorically) glue one to the end of another. When the first hard drive is filled, start writing data to the second. We can create a virtual hard drive consisting of two or more physical hard drives glued together in this way, and write data to the virtual drive as if it’s one big drive.
Alright, that’s easy, but it’s lacking in a few ways. First, there’s no redundancy: If one of the cheap hard drives in our stack of three fails, we’ve just lost a third of our data. Second, it seems slow: Accessing most files will only use one hard drive at a time, and couldn’t we get more performance by using multiple drives at once?
RAID 0: Striping
A striped RAID works the same way as a linear RAID, but it splits data across all drives equally. If you had two drives then you’d put the even bytes on the first drive and the odd bytes on the second drive. Then when reading or writing data you use both drives at once, for half as long, and so in theory get twice the speed!
In the real world we don’t write “even and odd bytes” but rather “even and odd chunks of bytes” called stripes, because that’s faster in practice. Same idea.
Redundancy is still a problem with stripes, perhaps even more than with linear RAIDs: If a hard drive dies we now lose “all the even chunks of every file”, which makes our remaining data just about worthless.
RAID 1: Mirroring
Mirroring creates a perfect backup of a drive. Every time we write data to one drive, we also write the data to all the backup drives. If one of the drives dies, we seamlessly continue using the rest. When we replace a dead drive, we copy all the data from the other drives in the mirror.
When reading data we can actually get performance similar to striping, by reading some chunks from one drive while reading other chunks from a second drive. Only data writes need to be synchronized across all the drives. Mirrors limit you to the size of a single drive (if you have three 1-TB drives that are all perfect copies of one another, you only get one terabyte of “real storage”), and the write speed of a single drive, but the combined read speed of all your drives.
RAID 10 (1+0): Striped Mirrors
If we have four hard-drives we can easily combine last two strategies: Create two sets of mirrors, and stripe data across them.
We get the storage capacity of two out of the four drives, the write speed of two drives, the read speed of four drives, and redundancy. The redundancy is slightly unintuitive: We lose nothing if any one drive fails, and we lose nothing if a second drive fails and it wasn’t the mirrored copy of the first drive that failed. In other words, as long as we’re lucky and we still have a full copy of the data across some combination of drives, then we’re okay.
With more hard drives comes more flexibility. Six hard drives can be organized as three mirrors of two drives each, or two mirrors of three drives each. The administrator chooses a trade off between more storage, more speed, and more redundancy.
RAID 01 (0+1): Mirrored Stripes
Don’t do this. If we reverse the order, striping two drives together and then mirroring the data to another two drives, we conceptually get the same result as a RAID 10. In practice however, a RAID 01 is more fragile. In most implementations, when one half of a stripe fails, the other half is disabled, too. Critical metadata, which tracks what stripes were allocated and placed on which drives, was kept on the now-dead drive, shattering the puzzle. Therefore when one drive in a RAID 01 fails, its striped partner also shuts down, reducing the 01 to a RAID 0. Don’t use 01, use 10.
RAID 5 / RAID Z
A RAID 5 distributes chunks across three or more drives so that any one drive can be lost without losing data. For example, assuming we have three drives, we can store even chunks on drive 1, odd chunks on drive 2, and the XOR of the two chunks on drive 3. Given any two drives, the information on the third drive can be re-created.
This lets us keep two thirds of the storage from our three drives, along with the read and write speed of two drives. Mostly a better trade off than a striped mirror! With four or more drives the dividends are even better, since we’ll get the storage capacity and read and write speed of three drives, then four, etc.
RAID 6 / RAID 2Z
Same idea as RAID 5, but the parity blocks (the XOR of the data blocks) are written to at least two drives. This means two drives can fail without losing data, and a RAID 6 is only possible with at least four drives.
Antique RAIDs
Alright, we covered RAID 0, 1, 5, and 6, what happened to 2, 3, and 4? They’re all poor designs that have been retired in favor of 5 and 6. Here’s a brief run-down:
RAID 2
Same idea as a RAID 5, except information is striped at the bit-level across all the drives, and the drives use Hamming codes to provide redundancy and error correction. This means that all the drives must spin in sync, so you can only access one file at a time, and reading and writing at a bit level makes the configuration slower.
RAID 3
Same as RAID 2, but stripes at a byte-level instead of bit, and stores XORs of the bytes on the last drive, which is a dedicated “parity drive”. Again requires that all drives spin in sync.
RAID 4
Same as RAID 3, but stripes at a block-level instead of byte. This means read performance is much better (you can frequently read blocks for one file from two drives while reading blocks for another file from a third drive), but write performance is still poor, since parity blocks are all stored on a single drive, which must be used for all writes.
Hardware or Software?
Traditionally to build a RAID you need a special “RAID card” on the computer, which connects to all the relevant drives and implements the RAID, presenting a single “virtual hard drive” to the motherboard and operating system. On more modern systems you can produce a “software RAID” where the operating system has access to the individual drives and produces a RAID on its own, using tools like mdadm or ZFS. This is sometimes more efficient, especially with ZFS, where the filesystem and RAID software are integrated and can read and write more efficiently than with a virtual disk.
Which type of RAID is right for me?
Choosing the type of RAID you want is a decision about how much redundancy you need, versus capacity and speed. Many servers have multiple RAIDs for different purposes. One additional consideration is that most computers can only boot off of mirrored RAIDs. This is because the BIOS, the code burned into the motherboard that initializes enough of the hardware to find the operating system and start it, is very small and not so clever. Stripes and RAID 5 clusters are complicated, but a drive from a mirror can be treated like a single independent drive. The BIOS finds one drive in the mirror and uses it to start the operating system, which then realizes it’s on a mirrored RAID and picks up the other drives.
Therefore, one common server configuration is to use two or more SSDs in a mirrored RAID for booting. These drives contain the operating system and all software, can be read at an absolutely blazing speed, and have redundancy because of the mirror. Then additional conventional drives are placed in a RAID 5 or 6 for a decent trade on performance and capacity, creating a larger pool of drives for data.
Distributed Hash Tables and Decentralized Data Storage
Posted 10/21/20
This post is mostly theoretical computer science (data structures, distributed systems) leading up to future posts that can talk about the design of decentralized communities with an emphasis on social theory (self-governance, trust, responsibility for content)
I’m at the (virtual) computer-supported collaborative work conference this week, and it’s stirring many ideas related to shared governance of decentralized communities. Before digging into those ideas, though, one more interlude about technical underpinnings of decentralized systems…
The Problem Space
We have information on a big central server, and we would like to spread it across many servers. This can be for a variety of technical reasons, including:
-
Redundancy, if the central server goes offline
-
Performance, if users can connect to a variety of servers then the average workload per server will be much lower
-
Resource limitations, if a central server with enough storage, processing, or bandwidth to support all users at once is infeasible
There may also be social reasons for desiring distribution, such as removing trust in a single central entity that could delete or modify data at will, preferring instead a solution where multiple parties have copies of data and can disagree on governance policy.
There are two broad ways of solving “distribution” that at first seem quite different, but are forced to tackle similar problems:
-
Everyone has a copy of all of the data
-
Everyone has a piece of the data
Mirrored Data Stores
Taking the “simple” case first, let’s assume we want to mirror data across multiple servers, such that each has an identical copy of all information. This is often appropriate for load-balancers and content-distribution-networks, where we really want “50 copies of the same website, hosted by servers across the entire planet.”
This is very easy if the content never changes! Just have a single “content provider” upload data to each server, and have users connect to the content distribution servers.
The problem is slightly more complicated, but still not too bad, if the single content provider can send out an update. We may have a chaotic transition period where some CDN servers have updated and some have not, but in practice all servers will have the new content “pretty soon.” If content is pulled rather than pushed, meaning that the CDN servers periodically connect to the main server and check for a new version of the data rather than the main server connecting to each CDN server to upload content, then we’ll need some marker to determine whether content is “new”. Some of the more obvious options are:
-
Always download content from the server, assume the server has the “ground truth”. Works, but wasteful.
-
Download content if it has a newer timestamp than the timestamp of the previous data. This works, but timestamps are generally messy because computers clocks can drift and need to be periodically re-synchronized via NTP.
-
Download content if it has a newer version number than the previous data. Same idea as the timestamp, but without the messiness of dealing with real-world “time”
This “versioning” lets us implement some helpful optimizations, like having CDN servers download updates from one another. CDN server 1 can download an update from the “main server”, while CDN servers 2 and 3 download from server 1, allowing the system to run smoothly even if the main server goes offline before servers 2 and 3 can be updated. All the CDN servers are always in agreement about what data is the “newest”, because a single source of ground truth increments a version number to disambiguate.
Let’s move to a messier problem: Server content is no longer static. Imagine collaborative editing software like Google Docs or Overleaf. Multiple users are making changes to a shared document, but that document doesn’t exist on a single server, but is rather spread across a range of servers for performance and redundancy. We must combine users’ edits to synchronize the servers and create a consistent view of the document.
We’ve lost the idea of single linear incrementing versions: Two users can add changes “simultaneously” (a loose definition, where “simultaneously” can just mean that the users made changes on two different servers before those servers had a chance to sync), and we need to come up with a deterministic ordering. Notice that timestamps don’t matter nearly as much as relative ordering and awareness: If Alice added a sentence to a paragraph, and Bob deleted that paragraph, then to combine the changes we need to know which edit came first, and whether Bob was aware of Alice’s edit at the time.
Lamport Vector Clocks
We can address the above challenges using a vector clock, which is basically a version number for each server indicating both what iteration of content the server is on and what updates it’s aware of from other servers.
When server 1 writes to server 2 it includes a list of all messages it doesn’t think server 2 knows about yet, based on the vector clock it received from server 2 the last time server 2 sent a message. That is, if server 1 has received (2,1,2) from server 2, it knows server 2 has “seen two messages from server 1, sent one message of its own, and seen two messages from server 3”. If server 1 has also received (0,0,3) from server 3, then server 1 knows about a message from server 3 that server 2 doesn’t know about. Therefore, when server 1 is ready to send a new message to server 2 it will first include the (0,0,3) message from server 3, followed by the new (3,1,3) message. In this way, it is not possible to receive a message without first receiving all the messages it depends on, guaranteeing an intact history.
Vector clocks assume all participants are truthful. If a server can lie about message timestamps or send multiple messages with the same timestamp then the “consistent world view” model can be trivially broken.
Notice that while we can use vector clocks to produce an optimal ordering of messages, we cannot eliminate all conflicts. Sometimes two users will introduce two conflicting changes, and both make incompatible changes to the same sentence. By frequently synchronizing servers we can make this scenario infrequent, but we need a resolution protocol like one of the following:
-
Manual intervention (as with git merge conflicts)
-
Automatic consensus for deciding which change to keep (as with blockchain stabilization when two competing blocks are mined)
-
A ranking system for selecting a change (for example, if a user replies to a tweet while the original poster deletes their tweet, either always delete the reply, or create an empty “deleted post” for the new tweet to reply to)
We now have a protocol for ordering changes from different participants and resolving conflicts. This is far from the only solution: We can also build consensus protocols like Paxos that only accept and proliferate one change from one participant at a time, guaranteeing zero conflicts even in the face of equipment failure at the cost of significant delays and overhead and the inability to work “offline” (like with git) and then merge in changes later when you’re online. There are many design trade-offs in this space.
Distributed Hash Tables
So far we have described decentralized systems for ensuring that all participants end up with the same data at the end. What about distributing data across participants so users can look up information they’re interested in, without having to store the complete dataset? This is where we introduce distributed hash tables, or DHTs.
The premise is simple: Take a hash table (an efficient way of implementing the more abstract “associative array”, also called a “dictionary” or “key-value table”), and sprinkle the key-value pairs across multiple participant servers, in an equal and deterministic way. With a traditional hash table you hash the key to determine the position the value should be stored at - in a distributed hash table we hash the key to determine which participant the key-value pair should be stored at.
In the trivial case, a client would maintain a network connection to every participant in a distributed hash table. When they want to GET or PUT a value for a key, they hash the key, determine which participant is responsible, and send the GET or PUT directly to the node.
Unfortunately, this scales poorly. If a DHT contains hundreds of thousands or millions of participants, expecting a client (or even a participant) to maintain millions of concurrent network connections would be unwieldy. Instead, we’ll employ a finger-table. Each participant will maintain links to the nodes 2^0 through 2^j ahead, where 2^j is less than the total number of participants. In other words, a logarithmic number of hops:
To dive all in on computer science terminology, this guarantees that all lookups are O(log n). In a DHT with millions of nodes, lookups will take a maximum of 20 or so hops. Much worse than the O(1) lookup of a traditional hash table, but… pretty good. This trade off means clients can connect to any participant in the DHT to submit a request, and the request will quickly bounce around to the correct destination. One network connection for a client, a handful for participants of the DHT.
Alright, so that’s how we store data in a DHT with a static structure. What about redundancy? How do we handle adding and removing nodes? How do we deploy a DHT in a chaotic peer-to-peer network rather than a data center?
Data Redundancy
For data redundancy, we can just store the key-value pairs in two locations! Instead of storing in hash(key) % participants we can store in the original location and in hash(key) + 1 % participants. For additional redundancy, store in + 2, etc. If the “location” of a participant in the DHT ring is random, then there’s no harm in storing in + 1. This is also convenient from a lookup perspective: We’re looking for data stored in participant 6, but participant 6 is offline? Send the query to participant 7 instead!
What if a participant and its backup get out of sync? How do we decide which value is “correct” for a key? Well, that’s what we have lamport vector clocks for!
Adding and Removing Nodes: Dynamic Routing Tables
Replacing a node in a DHT is simple: Contact every participant that links to the dead-node, and give them contact information to update their reference. This is relatively painless: O(log(n)^2) steps to send a RELINK message to all log(n) nodes with a link to the dead one.
Growing and shrinking the DHT is more challenging. The trivial solution, adding the new edges, informing all nodes of the new DHT size, and re-hashing and re-introducing all keys, is obviously too inefficient to be practical.
Let’s revise the structure of a DHT. Instead of numbering all of the nodes sequentially, 0 to n, what if each node has a large random number associated with it? To start with, just add a few zeros, and assume the nodes are numbered “0”, “100”, “200”, …, “1500”.
Now our key lookup mechanism is broken! If we run hash(key) % 1600 the vast majority of keys will be assigned to non-existent nodes! Alright, so let’s re-define the assignment: Keys are now assigned to the closest node number that comes before the “ideal” position. This means keys assigned to nodes “1400” through “1499” will be assigned to node “1400”, keys assigned to “1500” through “1599” will be assigned to node “1500”, and keys for nodes “0” through “99” will be assigned to node “0”.
Each node is still responsible for propagating a message forward through the network, until either the correct position is found, or it’s determined that the key does not exist in the DHT.
We’ll also need to change the linking in the network. Instead of linking to “+1”, “+2”, “+4”, “+8”, we’ll instead allocate each participant some “buckets”. These buckets will let a participant track links to “many nodes 1 or 2 distant”, “a moderate number 8 or 10 distant”, “a few 50 or 100 distant”, and so on. The same concept as a finger-table, just non-deterministic. If a participant doesn’t know any participants “about 100 away” they can instead send a lookup request to the known neighbors “about 50 away”, who are more likely to know neighbors that are closer to them.
This bucketing system makes it easier to introduce new participants: We don’t have to calculate all the participants that “should” have links to the current node number, we just have to send out an introduction, and nearby nodes are likely to add the new participant to their buckets, while distant nodes are unlikely to add the participant to their buckets. The same bucketing system is ideal for redundancy, because if a nearby neighbor goes offline (which we can check using a periodic ping/heartbeat system), a participant will have many other nearby participants in their bucket, and can continue operating without loss of connectivity. If one of the few distant links is lost, then the participant needs to send out a new lookup to find other distant peers to add to their finger-table buckets.
Therefore, when we add a new participant, say node “1355”, we need to send out an announcement. Many nearby participants will add “1355” to their finger-tables, and a handful of more distant nodes will, too. Key-value pairs destined for “1355” through “1399” will be re-allocated from node “1300” to our new participant, but will also be kept in “1300” and “1200” for redundancy, depending on the fault tolerance of the network.
This structure is still recognizably a DHT if we squint at it, but it’s a lot fuzzier now, with non-deterministic positioning and linking. Lookups are still deterministic, in that key-value pairs that exist in the network can reliably be found. We can also stabilize the structure of the DHT by adding an age-based probability function: Nodes that have been active for longer in the DHT (and are therefore likely to be online in the future) are more likely to be added to buckets, and more likely to be recommended in response to “find me more neighbor” requests. This means a new node will be added to many of its nearby peers, who keep large lists of nearby neighbors, but only long-lived nodes will be added to distant buckets. This means long hops across the DHT are much more likely to be reliable and efficient, and only once a lookup gets close to its destination, where participants have large redundant buckets, do connections become more chaotic.
DHTs in the Real-World
With the additions in the “dynamic routing tables” section, we’ve got a very approximate description of Kademlia, a widely used Distributed Hash Table model. BitTorrent, described in a recent blog post, uses a modified Kademlia DHT in place of a tracker, using trackers primarily for bootstrapping by introducing clients to participants in the DHT. The Invisible Internet Protocol, I2P uses a modified Kademlia to track routers and routes connected to the network. Many cryptocurrencies use a bucket structure similar to Kademlia to introduce participants to other peers in the network, but since the blockchain isn’t a key-value storage system they don’t use a DHT for data storage.
Now that we have an understanding of how to build a decentralized content-sharing system with peer introduction and routing, we can move on to more interesting topics: How to build useful systems and communities on top of this communication protocol, and how to build valuable social frameworks on top of those communities. But that’s for another post…
Network Science for Social Modeling
Posted 9/24/20
This post is meant to be very approachable and an academic background is not expected. However, it has an academic flavor and deals with applied theory, in the same vein as previous posts on lambda calculus and parallel computing.
This is a post about graphing social relationships. These techniques are used for advertisement, propaganda, predicting disease spread, predicting future relationships (as in LinkedIn “you might know” suggestions), predicting ideology or opinion, and a variety of other tasks. Network science is widely used in academia, in “big data” corporations, and by governments. This post will serve as a brief crash course into network science through the lens of social media scraping, with an emphasis on different models for representing relationships, and their use-cases and shortcomings.
Network Science and Social Scraping
Say we want to identify the most influential members of a community. “Influential” is a ambiguous term, and we could be referring to “the most well-connected individual”, or “the people that bring in ideas from outside the community”, or some notion of a “trend-setter”. To explore any of those definitions, our first task is to identify the members of the community and how they are inter-related.
To start we’ll draw a node (or a vertex if you come from a math/graph-theory background instead of computer/network-science) for Bob. We’ll identify all of Bob’s peers: their friends on Facebook, mutuals on Twitter, contacts on LinkedIn, or whatever parallel makes sense for the platform we’re studying. We’ll create a node for each peer, and we’ll draw an edge between Bob’s node and their friends:
We have our first network (or graph in graph-theory terminology). We can use this network to identify important nodes for the community, which usually involves some of the following characteristics:
-
The nodes with the most connections (the highest degree)
-
The bridge nodes that connect two communities together (Bob connects Alice to Dave and Carol)
-
The central nodes (Betweenness Centrality is a score based on how many fastest routes between any two nodes pass through this node)
We can create a larger network with more meaningful data by looking at Alice, Carol, and Dave’s peers, and building out further and further. The only limits are time and available information from the platform we’re studying.
Directional Relationships
Not all relationships can be described bidirectionally, like a friendship. For example, Twitter allows one user to follow another without reciprocity. Retweets, likes, and replies are all a form of connection that may or may not be bidirectional. To capture this distinction, we need to add direction to the edges of our graph to create a directed graph or digraph:
This changes the attributes we can measure, but only a little. Instead of degree to indicate how many connections a node has, we now have indegree and outdegree to indicate how many edges lead into and out of the node. This is usually even better, since we can now distinguish users that many people listen to from users that follow many people. Our measurements of bridges and centrality can also utilize direction, tracing only the paths a message can flow from one user to the next through a community.
There may be several attributes that can be thought of as a “relationship”. Returning to the Twitter example again, we have the following relationships:
-
Follows
-
Mentions
-
Retweets
-
Replies
All of these could be represented as edges on a social graph, but each relationship type has a different implication. Retweets (not including quote-retweets) most strongly indicate “support” and a positive relationship, since one user is rebroadcasting the message of another without commentary. Mentions and replies, on the other hand, could be positive or could indicate arguments and distrust. Follows are also ambiguous, since many users will follow individuals for news purposes, like their politicians, regardless of whether they support those individuals. Volume may also vary significantly between relationship types: Users may “like” messages widely, but retweet or reply to more select content.
Therefore, while we could draw one graph with an edge indicating any of the above relationships, we probably want to separate them. This could mean creating a separate graph for each category of relationship, or it could mean adding edge attributes that indicate which type of relationship each edge refers to. We can also use edge attributes to encode data like the number of retweets, or the age of a response. Comparing the attributes can lead to interesting discoveries, such as identifying a universally despised user that’s frequently mentioned by members of a community but never uncritically retweeted, or a user that used to be regularly retweeted, but has fallen from grace and is no longer amplified.
Community-Level Analysis
In addition to metrics for individual nodes, we can take measurements of an entire community. For example the degree distribution illustrates whether a community has about equal engagement, or whether a minority of users massively stand out as being followed more, mentioned more, retweeted more, depending on what the edges represent. We can also define group-level measurements like insularity, indicating what percentage of retweets by users inside of a group are retweeting other members of the group versus retweeting people outside of the group.
Most of these measurements only make sense if we take a much larger network sample, growing from our example diagrams of four users above to tens or hundreds of thousands. The following is one such network graph from Twitter data, created with SocMap:

Of course, community-level analysis requires a clear definition of who is “in” a community and who is not. Sometimes there’s a convenient external data point: If our community is “MIT students and graduates on LinkedIn” then we can define our in-group based on users with MIT in the education section of their profiles with a low degree of error. If our community is “right-wing users” on a platform like Twitter or Facebook then maybe we can create a fuzzy metric that scores users that repeatedly link to right-wing websites or frequently post specific right-wing-affiliated phrases. Highly scored users are likely to be part of the in-group.
Given solely network data there are algorithms for trying to “autodetect” communities based on the assumption that people in a community tend to be linked to other members of the community, but these algorithms are never as reliable as using external data, and frequently depend on analyst-supplied information like the number of communities to split users into.
Missing Data
Networks are constrained by what information is available, and it’s important not to overstate their accuracy. For example, not every friend will be friends on Facebook or connections on LinkedIn, or several users may know one another through a mutual friend that isn’t on the platform. There will almost always be nodes and edges “missing” from a social network graph. Sometimes this missing data is of primary interest! For example, “You may know” suggested connections on LinkedIn are based on a simple algorithm:
-
Identify 2nd and 3rd degree connections (that is, connections of your connections who you are not connected to)
-
Sort the potential connections by a combination of:
-
Shared peers (more connections in common)
-
Shared place of employment
-
Shared education
-
Shared skills and interests
Determining which attributes are most accurate predictors of a connection to optimize the above algorithm is a more difficult problem, and one LinkedIn has no doubt spent a great deal of time studying.
While networks are valuable tools for predicting patterns of behavior, it’s critical to remember that these network graphs represent only a slice of real-world connections. A snapshot of Twitter misses that many users may connect over Instagram, Facebook, or SMS, and messages spread across these “invisible” edges frequently.
Group Context and Hypergraphs
The biggest limitation we’ve seen with graphs so far is that it assumes all relationships involve only two parties. This is frequently appropriate, and accurately describes most phone calls, emails, and text messages. Unfortunately, it’s just as frequently inappropriate: A group chat between three people is not the same as as three two-party conversations between each participant. There may be topics you would discuss in private that you wouldn’t discuss in shared company, or conversely information you would dismiss as a rumor if it were shared with you privately, but seems more believable if it’s shared with your full peer-group. The context of a conversation is critical for understanding how information will be shared or accepted. Further, we can’t even assume that a group context implies members can speak individually: members of a group project may only speak together and never independently.
The simplest way to model these group contexts is to extend our definition of a graph. What if an edge can connect three or more nodes together? We’ll call this a hyperedge to distinguish from traditional edges, and we’ll call graphs containing hyperedges hypergraphs. For now, we can represent a hyperedge as a dotted line encompassing all nodes within it:
Obviously this will be messy to draw with many intersecting hyperedges, but we can perform a lot of mathematical and computer-sciency analysis without visualizing the network we’re working with, so that’s far from a show-stopper.
Note that our example includes only undirected hyperedges. We may also desire a concept of directed hyperedges to represent multicast messages. For example, an emergency hurricane alert broadcast to every cellphone in a city represents a shared message context, but only the emergency service can send messages in the group. Alternatively, consider a Telegram group chat configured as an announcement service, so a dozen or so administrators can write to the group, but thousands can listen. For some types of analysis it may be appropriate to represent these “broadcasts” as many directed edges from the broadcaster to every listener, but if the group context is important to preserve then we need a directed hyperedge to model the conversation space.
Complex Group Relationships and Simplicial Sets
Even directed hypergraphs have limitations, but to demonstrate them we’ll need to back up and explain an alternative solution to modeling group context.
The simplicial set represents group relationships with geometry. For example, if a triangle of edges represents three users with independent relationships with one another, then a filled triangle represents three users with a shared relationship with each-other:
If we want to represent a shared relationship between four individuals, we can switch to a tetrahedron (three sided pyramid, or a 3-dimensional version of a triangle). For five individuals, we create a 5-cell, the 4-dimensional equivalent of a triangle, and so on. Higher-dimensionality shapes rapidly become difficult to visualize, but it’s conceptually sound.
Multiple shapes in this geometric space can interact with one another. For example, consider two adjoining triangles:
We can describe DE in two ways. DE can be the shared edge between CDE and DEF, indicating a shared context in that DE is a sub-group that bridges the two larger triangles. However, we can also add an edge between D and E, indicating that they have a relationship outside of this shared bridge space.
Similarly, we can describe a tetrahedron either as the three-dimensional space encompassing four nodes, or as a union of three triangles, or as a combination of triangles and three-space. The difference in phrasing can represent a group of four people or a collaboration between multiple sub-groups.
Sub-grouping and intersection is extremely difficult to describe in a hypergraph. We can create a concept of a hyper-hyperedge which links two hyperedges together to simulate a metagroup, but this is at best an awkward substitute. A hyper-hyperedge still leaves great ambiguity distinguishing separate teams that communicate versus intersections between teams, and making a group that consists of some individuals and some other groups becomes messy very quickly. If we stick to hypergraphs we must content ourselves with representing many group dynamics as footnotes outside of the graph itself, which makes analysis extremely difficult.
Finally, simplicial sets are always directional. We can have multiple congruent but distinct triangles, ABC, BCA, CAB, ACB, and so on, which represent distinct social contexts involving the same three people. We can easily simulate undirected groups using simplicial sets (by sorting all participants before describing a group), but if directionality is desired to represent social hierarchy or multicast communication then the distinction is already built into simplicial group definitions.
Unfortunately, moving from theory to practice is more challenging. Simplicial sets are based on category theory and algebraic geometry, and the math involved reflects that. While there are well-developed software tools for working with undirected and directed graphs, there are few for hypergraphs, and almost none for simplicial sets, limiting present adoption outside of theoretical mathematical spaces.
Conclusion and Real-World Tools
This post provides an extremely high-level overview of network science within the context of building relationship maps from social media. It’s a flexible discipline, and network analysts spend as much time (if not more) determining which measurements are appropriate and what metrics mean in terms of real-world behavior as they do working through math and code. Because nodes and edges can represent such diverse phenomenon (and this post only scratches the surface without mentioning multi-layer and bipartite networks) most network analysis tools require significant configuration and code from analysts to produce meaningful results.
With that said, some of the versatile libraries used for network analysis in Python include NetworkX, iGraph, and graph-tool. While each library has a limited ability to render networks for visual inspection, most analysts turn to Gephi or (my personal favorite) Cytoscape to explore their networks and display them for publication.
For more on hypergraphs and simplicial sets, I found this paper to be approachable despite lacking any category theory background.
What is a Supercomputer?
Posted 8/19/20
This will be another introductory academic post like the last post explaining how torrents work.
We’ve all seen references to “supercomputers” in popular culture, run by institutions like NASA, the Chinese government, Bond villains, and other nefarious groups. But what is a supercomputer, and what distinguishes one from a “normal” computer? Surprisingly, this isn’t even discussed in the curriculums of many computer science programs unless you happen to take electives in parallel computing.

The Basics
Supercomputers, better called cluster computers and often referred to as high performance computing (HPC), consist of racks of conventional computers, tied together with special interlinks to share information as quickly as possible, and loaded with software to run pieces of a program across each of the computers in the racks. Whereas most desktop and laptop computers have a single processor, allowing them to do only one thing at once (or, with a 4-core or 8-core processor, to almost do 4 things or 8 things at once), a supercomputer consists of dozens to tens of thousands of CPUs, and up to millions of cores, allowing it to run many tasks concurrently. Notably, the processors inside aren’t any different than the ones in a desktop, and certainly aren’t any faster: Many of the computers on the Top500 High Performance Computers list run Intel Xeons, and some clusters are clocked as low as 1.45 Gigahertz. If you could somehow run the latest Halo game on a supercomputer there’d be no meaningful speed-up over your home computer. Code must be written specifically to take advantage of the enormous parallelism available on a cluster computer to achieve any performance gain.
What workloads benefit from this kind of parallelism? Mostly large simulation work: weather prediction, epidemic spread, economic impact estimation, industrial engineering to design boxes that can be moved quickly on an assembly line without tipping over, etc. These are usually simulations with a large number of variables, where it is desirable to run a hundred thousand slightly different configurations of the model and determine optimal, average, or worst-case outcome. All problems that require an enormous number of calculations that mostly do not depend on one another and so do not have to be run sequentially.
The Hardware
We made an allusion to hardware interlinks in clusters being a “magic sauce” that makes everything so quick. Before discussing the software written for these magic interlinks, we should dig deeper into how they work.
Most cluster systems include some kind of peer-to-peer network system with very custom attributes: Usually it can directly write to memory in userspace, the network itself can handle operations like receiving multiple messages and adding them together before delivery, and it all runs very quickly with as much networking logic implemented in hardware as possible. For those familiar with Internet networking, these networks are usually similar to UDP in that there’s no need for fault tolerance, guaranteed delivery, or checksumming if the cables are high enough quality to ensure zero data loss, and routing is much simpler since the entire network topology is fixed and predefined.
So that’s the hardware link, but equally important is the network topology, or which computers are linked to which others. This networking hardware is extraordinarily expensive, so linking every node to every other is infeasible, and for most programs wouldn’t give much of a performance boost anyway. Supercomputer designers must make tradeoffs to allow information to be distributed through the cluster efficiently using as few links as possible.
Some supercomputers use a simple Fat Tree topology where high level routers forward messages to “pods” of compute nodes:
This is appropriate for simple workloads where each node in the cluster needs to receive information at the start and then works independently until results are combined at the end. However, for any workload where nodes regularly need to share data with one another this puts a great deal of strain on the switches, and introduces latency in larger trees.
Some cluster systems, like the now-retired IBM Blue Gene series use a Torus topology that organizes nodes into a rectangular prism with links along every axis and wrapping around each row and column. The Blue Gene systems use 3-dimensional and 5-dimensional torus networks, but we’ve limited ourselves to two dimensions to simplify the diagram:
Other supercomputers use radically different topologies, like the Cray butterfly network, which lacks the wrap-around flexibility of a Torus but can quickly distribute and re-combine top-level results using few links:
Each of these network structures changes the number of hops required to send information from one node to another, and whether there are local “groupings” of compute nodes that can communicate quickly without sending messages to distant nodes.
The Software
Now we have a cluster of computers, wired in an elaborate communications network using custom very high-performance interlinks. Cool, but how do we write code that actually uses that architecture? Most supercomputers use some variant of the Message Passing Interface, like OpenMPI, to describe parallel operations.
From the programmers perspective, an identical copy of their program runs on every compute node in the cluster, except that each copy is aware of both how many nodes exist, and the number of their own node in the cluster. For anyone used to systems programming, think “the program has been forked once for each node before the first line of main”.
The program then loads data into each node, either by loading all the data into one node and distributing it, or by using a networked file system so that each node can directly read the starting data relevant to its work.
The message passing interface defines a number of basic operations that form the basis of parallel programming:
-
Scatter: Take an array and send a subset of the array to each node in a list
-
Gather: Take a small array from each node in a list and combine into a single large array on the gathering node
-
Send / Recv: Send a single message directly to another node, or block on receiving a message from another node
-
Barrier: Similar to a multi-process breakpoint, all processes must reach this line in the code before they can proceed, synchronizing the nodes for scatter and gather operations
Since each node is a separate process with independent memory, there are few shared resources between nodes and usually no complexities around threading and mutexes and variable race conditions unless a process uses multithreading internally. Data sharing between nodes is entirely via send and receive calls or synchronized scatters and gathers, making it (relatively) easy to track data dependencies and avoid collisions.
Message passing performance is closely tied with the network structure of the cluster computer. Therefore, for more complex simulations with frequent message passing the programmer must be familiar with the configuration of their particular cluster system, so they can break up work in a way that places tasks with data dependencies on “close” nodes within the cluster. This also means that programs written for one cluster computer must be re-tuned before they can be effectively deployed on another cluster, or risk massive slow-downs from inefficient message passing and network clogging.
The Interface
We’ve described how a supercomputer is built, and how code is written for it. The last piece is how to interact with it. You can’t exactly ssh into a cluster system, because it isn’t a singular computer: Each compute node is running its own operating system (usually a thoroughly tuned Linux distribution), and the only applications that cross between nodes are ones written specifically for use with the messaging interconnect system.
Instead, one or more nodes in the cluster are designated as “I/O nodes” that can be sshed into. The user can upload or compile their software on these landing pads, and from these systems can submit their executable as a job. Then, much like a mainframe system in the 1970s, a batch scheduling system will decide which jobs will run on which nodes in what order to maximize use of the cluster and potentially ensure fair sharing of resources between users.
What about Graphics Cards?
While general-purpose Central Processing Units (CPUs) usually have only four to sixteen cores, more special-purpose Graphics Processing Units (GPUs) in graphics cards typically have hundreds to tens of thousands of cores in a single computer! Why don’t we use these for massive parallelism? The answer is “we do when we can” and “it’s very hard”.
The reason graphics cards can have so many more cores than a CPU is that graphics processors are simpler and can do far less, which means the cores are physically smaller and require less power, so many more can fit on a chip. Many GPU operations involve working on vectors: for example, you can multiply a vector of a thousand elements by a scalar in one step by using a thousand cores to manipulate the vector in parallel, but you cannot direct those thousand cores to run independent operations in that single step. If and when programs can be expressed in terms of the limited operations possible on a graphics card then we can take advantage of the massive parallelism available there.
Most recently-built cluster systems include graphics cards in each node, so that complex work can be distributed across compute nodes, with the abstract tasks handled by the CPUs, and the rote mathematics handled by each graphics card using APIs like CUDA and OpenCL when possible.
Torrents: Decentralized Data Storage
Posted 8/13/20
This post is explanatory in the vein of past posts on memory allocation and lambda calculus, rather than introducing new social or technical theory
Torrents allow your computer to download files from many computers simultaneously rather than from a single web or file server. BitTorrent is frequently associated with piracy, but is on its own a benign technology, used for distributing Linux installation files and World of Warcraft updates. But how do torrents work, and how can that architecture be re-purposed for other applications?
The Motivation: Consumer ISP Bottlenecks
To understand the design of BitTorrent we’ll first look at the exact problem it was built to solve. Home ISPs sell consumers large download speeds and comparatively minimal upload speeds. This is because most users do very little uploading: Maybe they send an email or upload a photo to Facebook, but most of their “upload” bandwidth is just used to send HTTP requests to download more things. Therefore, ISPs can maximize the use of their infrastructure by designating more equipment for bringing data into a neighborhood and very little of it to bringing data out. This allocation also means consumers can’t effectively run a website or other service from their home without paying through the nose for a “commercial Internet plan”. How much of this bottleneck is a true technical limitation and how much is purely a money-grab is hard to answer since ISPs are usually not forthcoming about the resources they have available. Regardless of the reason, this is the common reality in U.S. home networks.
So, when some home users do want to send files to one another, they face a dilemma: They can download files quickly, but sending files to their friends takes ages. For example, Alice may have a download speed of 30mbps but an upload speed of 1mbps. If only they could work together with 29 friends, then they could share files at a full 30mbps…
What would home users want to distribute this way? Anything bigger than an image you could text to a friend. Music, movies, operating systems, leaked documents, libraries of scientific papers. Torrents present a community-driven approach to disseminating information, opposed to the top-down centralized paradigm of “files are distributed by companies like Netflix and Google that have the wealth and means to send data.”
Technical Details
Alright, so how does that work in practice? Well to start with we need to break the target file into small parts that can be downloaded independently. Each part will require an identifier so a downloader can ask for a specific piece, and will also need a hash so the downloader can know they’ve successfully downloaded the piece and it hasn’t been corrupted or tampered with.
Next we’ll need a way of distributing this information to potential downloaders, and most critically, we’ll need a way to put the downloader in touch with all the users that may have parts of the file to upload.
Torrent Files
Torrent files solve the first problem. A torrent file contains the metadata for a download. Specifically, they include:
-
The torrent name
-
A hash of the completed file
-
The number and size of each part
-
A list of files
-
A list of parts and part hashes for each file
-
Some optional metadata (creation date and torrent software, comments from the author, etc)
-
A list of trackers
Most of these fields are self-explanatory, and for now let’s just say “trackers” solve the second problem of putting the downloader in touch with uploaders. Now to distribute data we only need to send this .torrent file to the downloader, and they can use it to bootstrap the download and gather data from everyone. Torrent files are tiny, at most a few megabytes to represent hundreds of gigabytes or even terabytes of data, so sending a torrent file via direct download is not a demanding requirement.
Trackers
Clearly the magic sauce here is the “trackers” field of the torrent file. A tracker acts as a rendezvous point between uploaders (“seeders” in torrent terminology) and downloaders (“leechers” in torrent-speak, at least until they begin helping upload data and become seeders themselves). The process is surprisingly simple:
-
A user with torrent data to share or download connects to the tracker and announces the file hash it is interested in
-
The user then submits its IP address and some port numbers it is reachable at
-
The tracker responds with a list of IP addresses and ports to reach every other user that’s recently indicated interest in the same file
Users periodically repeat this process, both to confirm with the tracker that they remain active and interested in the data, and to potentially find other users that have registered with the tracker since the last time they checked.
That’s it. The tracker doesn’t act as any kind of proxy, it doesn’t have any information about the torrent file or what pieces of the file each user possesses, and it can’t distinguish between seeders and leeches. Just hashes and contact information.
So, doesn’t this violate the entire “decentralized” nature of torrents? There’s a single central server maintaining all the contact information that this entire system relies upon! Well, yes, but actually no. Most torrent files include a list of several trackers, instructing seeders “Please share your contact information with these five servers”, providing a good deal of redundancy. If for some reason all five servers (or however many were added to the torrent) go offline or ban the file hash and refuse to offer rendezvous services, then the data itself is still safe on the computers of all the seeders. Anyone with technical know-how can add new trackers to the torrent file, hopefully allowing the seeders to reconnect.
Nevertheless, trackers remain a point of failure in BitTorrent networks, and modern versions of the BitTorrent protocol further minimize the role of trackers using a distributed hash table, discussed below.
Indexes
What we’ve described so far is enough for the BitTorrent network to function if I email you a .torrent file to start you off. The only piece of the puzzle we’re missing is content discovery: If we want to spread torrent data further than a group of friends and make it a true community then we need a website that hosts torrent files and makes them searchable so that users can find what they’re interested in. These websites are called “indexes” and include notorious websites like The Pirate Bay. Note that indexes have an even smaller role in the network than trackers: Indexes are how new users discover new torrents, but they don’t distribute any data, and don’t even distribute contact information to reach seeders that do distribute data. If an index like The Pirate Bay goes offline all existing torrents will be completely unaffected, and the torrent files will usually be quickly reposted to an alternative index website.
An Example
Pulling it all together, to download data using a torrent, a user must:
-
Find the torrent file on an index site and download it to open in their favorite torrent software
-
Use their torrent client to connect to a set of trackers and locate other peers for the torrent data
-
Connect directly to those peers and ask for any pieces the user doesn’t yet have
Finally, the user downloads the file pieces from each seeder, distributing the load to maximize download speed:
Firewalls
In order for all of this to work, torrent peers must be able to directly connect to one another to request pieces of torrent data. Don’t firewalls (including the Network Address Translation used in almost every home network) prevent such direct connections? Yes! Fortunately most torrent clients support “Universal Plug and Play”, a protocol that allows software within the local network to speak with the router and temporarily add port forwarding rules to open connections to itself. The torrent client will open a handful of ports for data transfer (usually TCP ports 6881-6889) and then announce these ports to the tracker (often over UDP ports 6969 or 1337).
If the user is behind carrier-grade NAT, or is otherwise unable to use UPnP to automatically open ports, then the user will either need to manually open and forward the ports (if their cgNAT ISP allows them to), or will be unable to upload data using BitTorrent.
Rewarding Helpfulness
The entire BitTorrent network relies on users contributing their own bandwidth to support the broader community, but what’s to prevent users from skimming off the top and downloading data without sharing anything back? In fact, nothing prevents this, and unsupportive leechers are common, but BitTorrent does have a means of mitigating the harm leeches can cause.
Every BitTorrent node allocates its upload bandwidth proportional to the upload speed it receives from other peers. In other words, if Alice uploads lots of data quickly to Bob and the data passes hash verification, then Bob will consider Alice a “good peer” and will prioritize sending them data in return.
This reward system emphasizes sharing data with peers that will share the data with others. It can alternatively be seen as a punitive system: Peers that do not enthusiastically share their data with others will be given the lowest priority. For a popular torrent with hundreds or thousands of peers, this becomes a kind of “tier” system, where high-speed uploaders are mostly paired with high-speed peers, and low-speed uploaders are mostly paired with low-speed peers.
Magnet Links and the Distributed Hash Table
In a modern torrent system the network is even more thoroughly decentralized, and trackers are relegated to a tiny (but still critical) role of making first introductions. The idea is to distribute the previous role the trackers held across every participating peer: By using a distributed hash table (DHT), peers can each cache part of the “hash -> contact information” dataset the trackers held, and users can now find peers for torrents they’re interested in by asking for introductions from peers they’ve met through previous torrents.
The effect is that once you’re “in” the peer-to-peer BitTorrent network, you never have to leave again, and can perform all BitTorrent operations from within the peer-to-peer space. The only time a tracker is needed is when a new peer who doesn’t know anyone else in the network yet wants to join, or an old peer has been disconnected for long enough that its peering information is out of date and it can no longer reach anyone. In these cases, it remains necessary to contact a tracker and acquire an initial set of peers to enter the peer-to-peer network.
So what do torrents look like in this new DHT network? They no longer require torrent files at all. All the fields stored in the .torrent file can be stored in the distributed hash table instead, so the information a peer needs to start their download is reduced to a single string containing the hash, called a magnet link: magnet:?xt=urn:btih:c8dd895fbc6cd38850205bf09c76a9b716b2cd87
From that string alone, the torrent client can identify the “exact topic” (xt), which is a “uniform resource name” (urn) consisting of “BitTorrent info-hash” (btih), which is just a hex-encoded SHA-1 hash of the torrent file. The torrent client knows to make a query to the distributed hash table for metadata and peers for the torrent with the hash c8dd895fbc6cd38850205bf09c76a9b716b2cd87, and from there begins the download.
We can optionally include additional information in the magnet link to make it more useful, including the filename (with the “dn” field), file length (with the “exact length” or “xl” field), and trackers to fall back to if the client doesn’t have DHT peers already (with the “tr” field). Therefore a more informative magnet link might look like:
magnet:?xt=urn:btih:c8dd895fbc6cd38850205bf09c76a9b716b2cd87&dn=Stuxnet.zip&xl=7911599&tr=udp%3A%2F%2Fopen.demonii.com%3A1337&tr=udp%3A%2F%2Ftracker.coppersurfer.tk%3A6969&tr=udp%3A%2F%2Ftracker.leechers-paradise.org%3A6969&tr=udp%3A%2F%2Ftracker.blackunicorn.xyz%3A6969
If the tracker information is left off then the magnet link is only usable by clients connected to the DHT, and anyone else must first download some other torrents using trackers to become established, and then try again.
These magnet links are tiny because no “piece” information is stored in them, and are therefore convenient for texting or emailing. The smaller size significantly reduces the storage space needed to run a torrent index, and so further supports decentralization and redundancy in the torrent ecosystem.
Architectural Takeaways
BitTorrent provides an excellent example of how to run any peer-to-peer system: using a set of central servers to make introductions, then switching to direct connections to exchange information. Ideally a distributed hash table means the central servers are only needed to bootstrap new users, who can rely solely on direct connections from that point on. While BitTorrent is used for file sharing, there’s no reason the same architecture can’t be used for other distributed systems.
Indeed, Bitcoin uses a similar network for storing their distributed blockchain, except that they have a hard-coded list of starting peers in the Bitcoin software and rely on these peers and the DHT instead of trackers. The Tor Project also uses a similar system, where their ten or so hard-coded directory servers provide contact information for Tor nodes, but once the contact list is downloaded a Tor client acts independently and connects directly to all nodes. The Inter-Planetary File System stores files in a DHT as a kind of hybrid between the way we think of the World Wide Web and torrents, and similar to Bitcoin uses a list of “bootstrap peers” included in the software for identifying other members of the DHT.
Trustless Pursuance: Decentralized Architecture
Posted 7/7/20
In a rapid series of events, Distributed Denial of Secrets was banned from Twitter for our BlueLeaks release, along with any links to our website, the leaked documents in question, or magnet links to the leaked documents in question (including blocking URL-shortened links, forwarding domains, and a ROT13-encoded version of the magnet link). Shortly after, one of the main DDoSecrets servers was seized by the German authorities, rendering the document archive and search engine unreachable. The raw documents were hosted with torrents and have all been mirrored elsewhere, but the loss of Twitter as a soapbox, as well as the index and search engine, are unfortunate setbacks.
Following the trend of other groups deplatformed from mainstream social-media, DDoSecrets has moved to Telegram and is looking at alternative media options for making announcements. On the hosted infrastructure side, we have dedicated servers for specific projects that remain online, but a shoestring budget limits our ability to operate a separate server for each task with many redundancies.
All of this is to emphasize the importance of decentralized systems, avoiding central points of failure and single-party censorship (as opposed to cooperative censorship). When considering the design of the Pursuance Project, we want a system that can outlive Pursuance as an organization, and can survive without the Pursuance Project’s servers if they’re lost due to lack of funding or censorship or equipment failure.
This post proposes a model for Pursuance without reliance on a permanent and trusted server, for use by groups like DDoSecrets that cannot afford such centralized dependencies. We begin by looking at peer-to-peer chat software, and building from there.
Ricochet
Ricochet is an anonymous encrypted “instant” messaging program. It works by hosting a Tor Onion Service on each user’s computer. To write to another user you need to know their onion service address, at which point both computers can connect to each-other’s onion service and send messages. This eliminates the need for any centralized chat server, requires no network configuration (such as domain registration and port forwarding), and hides every user’s IP address from one another.
Unfortunately, Ricochet has a range of shortcomings. Messages cannot be delivered while a user is offline, allowing only synchronous communication. There is no possibility for group-chats, and the trivial solution of “send a message to each user in the group” would require everyone in the group-chat to be online at once and is completely unscalable.
Cwtch
The good people at Open Privacy have been working on a more sophisticated chat system built on top of Ricochet, known as Cwtch (pronounced “kutch”, translating roughly to “a hug that creates a safe space”). The basic premise is to use Ricochet for peer-to-peer messaging, but to add an untrusted server that can cache messages during offline periods and facilitates group-chat. The server cannot read any messages, and will relay messages to any user that connects and asks. Each message is signed, preventing tampering, and includes a hash of the previous message from the user (blockchain-style), making omission easily detectable. Therefore the server cannot act maliciously without detection, and because it cannot identify users or distinguish their messages, it cannot target specific users and can only act maliciously at random.
Users create a group chat by direct-messaging another user (via Ricochet), establishing a shared symmetric key, and then relaying messages through the untrusted server encrypted with this key. Users are added to the group chat by providing them with the onion address of the relay and the symmetric key. Forward secrecy is achieved by periodically rotating the key and providing the update to all members of the chat via direct-message on Ricochet (and posting all messages using the old and new keys until rotation is complete). Backward secrecy is achieved by not providing these updated keys to compromised users. Users can be removed from a group by updating the shared key and providing it to all but the removed user. More technical details in the Cwtch whitepaper.
It’s important to note how minimal the role of the relay server is in this design. The majority of the work is performed by the client, which discards messages from the relay that aren’t encrypted with a group key the user is in, discards duplicate messages, and parses the contents of messages. The client can be connected to multiple groups on multiple servers concurrently, and a group can be moved from one server to another seamlessly, or even use multiple servers at once if messages are relayed through each server. Since the server is just a relay, and connects via Tor, it requires virtually no configuration and limited resources, and can be trivially deployed.
Cwtch has a few drawbacks (aside from being alpha software not ready for public use), but they are relatively small:
-
The user that created the group has the responsibility of periodically rotating keys and distributing those keys to users via Ricochet. This can be automated, but it requires that the founder periodically log in, and if they abandon the group then key rotation will cease and forward and backward secrecy are lost. This places the founding user in an “administrative” role, which is reflected by their ability to add and remove users, unlike in Signal where no user is an administrator and the group can only be added to.
-
There is no system for initial key exchange. Users sign their messages to mathematically prove a lack of tampering, but this is only effective if users exchange keys ahead of time over a trusted platform. This can be alleviated with something like Keybase proof integration to demonstrate that a Cwtch user has a well-established identity on many platforms.
Cwtch is intended to be used as an open source platform for peer-to-peer messaging with groups, allowing others to build more complex software and interactions on top of that foundation. So, let’s do just that…
Pursuance on top of Cwtch
What would it take to decentralize Pursuance so that it exists entirely client-side, with no storage except as messages sent via Cwtch to eliminate a need for a central Pursuance-specific semi-trusted server?
For basic functionality, not much is required. We can describe a pursuance as a Cwtch group-chat with a ton of meta-messages. The first message in a pursuance declares the rules of the pursuance (describing what roles exist) and how they interact), and metadata like the pursuance name. Subsequent messages take one of the following formats:
-
Changing Rules (Creating or destroying roles or amending how roles interact)
-
Changes Roles (Assigning or de-assigning a role from a user)
-
Tasks (Creating, closing, assignment, and commenting on tasks)
Under this sytem, every user in the pursuance has all data in the pursuance, including data they do not have permission to access. Therefore, all tasks must be encrypted to only be readable by roles with permission to read the data. A role exists not only as a designator, but also as a shared key allowing the user to read messages encrypted for that role. Adding and removing users both fall under the category of “changing roles”.
Clients have access to all pursuance rules, and a list of all users and their roles, and so clients can reject illegal messages, such as a user closing a task they have no access to. Since all content in a pursuance consists of tasks and discussions associated with those tasks, this messaging system describes the entire infrastructure of a pursuance.
Cwtch handles “desynchronizing” in a decentralized manner, allowing one user to contact another and get caught up on messages they’ve missed. This is intended to elegantly handle Cwtch relay servers that only cache recent messages, and to allow a smooth transition if the group has moved between servers (because, perhaps, the original server has gone offline). Pursuance inherits this re-synchronization, and allows users to catch up if the pursuance has moved servers.
So to summarize, the advantages of this change include:
-
Encrypted messaging provided by Ricochet and Cwtch instead of reinventing the wheel in Pursuance
-
No central and trusted server required, easily moved in case of server failure
-
Automatic recovery in case of data outage
-
Only have to maintain one piece of software, the Pursuance client, instead of a client and a server
However, there are a number of hurdles remaining (besides Cwtch itself, which remains in Alpha):
-
Synchronizing keys between different pursuances to cross-assign tasks can be complicated
-
Sending tasks between pursuances is challenging: the task must be sent by a user, and the receiving pursuance must somehow verify that the sending-user is part of an approved role in the sending-pursuance
-
All of this becomes harder if a pursuance can move from one server to another and disrupt lines of communication with its neighbors
-
Pursuance discovery remains challenging, and it is unclear what “joining” a pursuance looks like unless new users invited from inside
-
The “group leader” role from Cwtch must be inherited by Pursuance, probably as the pursuance founder; There must be an elegant process for migrating the pursuance and underlying Cwtch chat if the leader becomes inactive
Cwtch isn’t the only option for decentralized data storage and messaging, and alternatives should be considered. One notable alternative is Tox, which stores messages in a decentralized hash table, much like torrents. Another is the InterPlanetary File System, which acts somewhat like an HTTP and git replacement, storing web data with version history in a distributed filestore. A more complete Pursuance implementation may combine several of these technologies - for example storing encrypted tasks on IPFS so they can be accessed by multiple pursuances, but running metadata for a pursuance and exchanging keys within Cwtch. This post should be considered an early abstract for what distributed Pursuance software might look like.
Information Paradigms and Radical Interfaces
Posted 6/16/20
One of my non-social-org interests is the design of interfaces for viewing and interacting with information that can change our perception and thought-processes surrounding that information. I haven’t written much on this subject yet (except tangentially when discussing Halftone QR Codes to create dual-purpose links/images), so this post will be an overview of information paradigms and exciting ideas in the topic space.
Conventional Model: Folder Hierarchies
When computers were imagined as information storage and retrieval systems, they first replaced their physical predecessors: Filing cabinets filled with nested folders. This hierarchy describes every major “filesystem”, including directory trees on Unix/Linux and Windows:
However, a simple hierarchy fails to describe information that belongs in multiple places at once: What if a file could be categorized under “Research” or under “Gradschool”? We can address this problem with links or aliases (so the file is in the “Research” folder but has a reference in the “Gradschool” folder), but it’s an imperfect solution to an awkward shortcoming.
Predominant Internet Model: Hypertext
While a folder hierarchy allows one file to reference another, it does not allow for more sophisticated referencing, like a file referring to several other files, or to a specific portion of another file.
Both of these problems can be improved with hypertext, which introduces a concept of a “link” into the file contents itself. Links can refer to other documents, or to anchors within documents, jumping to a specific region.
Hypertext is most notoriously used by the World Wide Web to link between web pages, but it can also be used by PDFs, SVG files, and protocols like Gopher. Still, there are more sophisticated relations that are beyond hypertext, like referring to a region of another document rather than a specific point.
Xanadu
Ted Nelson’s Project Xanadu aimed to extend hypertext dramatically. Xanadu departed from the idea of static documents referencing one another, and proposed dynamically creating “documents” out of references to information fragments. This embedding allows bidirectional linking, such that you can both view a piece of information in context, and view what information relies upon the current fragment. The goal was to allow multiple non-sequential views for information, and to incorporate a version control system, so that an information fragment could be updated and thereby update every document that embedded the fragment. Information storage becomes a “living document”, or a thousand living documents sharing the same information in different sequences and formats.
Perhaps unsurprisingly, Xanadu’s scope has hindered development for decades. A subset of Xanadu allowing embed-able fragments can be seen in a demo here. The bidirectional-reference model struggles to mesh with the decentralized reality of the Internet and World Wide Web, and a central database for tracking such links is impossible at any significant scale. HTTP “Referer” headers ask browsers to notify web servers when another document links to one of its pages, but the system was never widely deployed as a way of creating bidirectional links. Tumblr and Twitter “reblogging” and “quote retweeting” comes closer by creating bidirectional references, but falls short of the living-document paradigm. Wikipedia accomplishes bidirectional links within its own platform, and allows anyone to edit most pages as they read them, but still considers each page to be independent and inter-referential rather than dynamically including content from one another to create shifting encyclopedic entries.
Some projects like Roam Research continue developing the Xanadu dream, and support embedding pieces of one document in another, and visualizing a network diagram of references and embedded documents. There’s a good writeup of Xanadu’s history and Roam’s accomplishments here.
Explorable Explanations
Linking information together between different fragments from different authors is an insightful and revolutionary development in information design; but it’s not the only one. Bret Victor’s essay Explorable Explanations provide an alternate view of information conveyance. It critically introduces the concept of a reactive document, which works something like a research paper with a simulation built in. Any parameters the author sets or assumptions they make can be edited by the reader, and the included figures and tables adjust themselves accordingly. This provides an opportunity for the reader to play and explore with the findings, develop their own intuition about how the pieces fit together. There’s an example of this kind of interactive analysis at Ten Brighter Ideas.
Visual Exploration: XCruiser
All the models so far have focused on articles: organizing articles, moving between articles, synthesizing articles out of other articles, and manipulating the contents of articles. Other paradigms move more radically from simulating sheets of paper.
One such paradigm is XCruiser, which renders filesystems as three dimensional space. Directories are concentric galaxies, while files are planets. The user literally “flies” through their computer to explore and can see parent, child, and parallel directories in the distance.
It is, perhaps, not an intuitive or particularly useful model. Nevertheless, it demonstrates that our classic “hierarchical” view is far from the only possibility. A similar 3-D filesystem renderer is FSV, the File System Visualizer, featured in Jurassic Park.
Kinetic Exploration: Dynamicland
Finally, interfaces need not be purely visual, reached through a monitor, keyboard, and mouse. Bret Victor’s most recent and daring project, Dynamicland seeks to reimagine the boundaries of a physical computer. Terribly oversimplified, the idea is:
-
Strap a number of projectors and cameras to the ceiling, aimed at the floors and walls
-
Give the computer OpenCV to recognize objects and read their orientations and text
-
Program the computer to display information via any projector on any surface defined by physical objects
-
The entire room is now your computer interface
Ideally, the entire system can be developed from this point using only physical objects, code written on paper, a pencil on the table turned into a spin-dial referenced by a simulation on the wall. No screens, no individual computing.
The main takeaway is that the computer is now a shared and collaborative space. Two computer-users can stand at a wall or desk together, manipulating the system in unison.
Almost all our computing technology assumes a single user on a laptop, or a smartphone. We put great effort into bridging the gaps between separate users on individual machines, with “collaboration” tools like Google Docs and git, communication tools like E-Mail, IRC, instant messaging, slack, and discord. All of these tools fight the separation and allow us to compute individually and share our efforts between computers, but Dynamicland proposes a future where a shared space is the starting point, and collaboration emerges organically.
Alternative Social-Media Platforms
Posted 6/12/20
This post is an informal discussion related to a research project I’ve been involved in and the broader context of alternative media platforms, deplatforming, and community building. This is not peer-reviewed academic work; see the paper for that.
Background
Mainstream social media platforms (Facebook, Twitter, YouTube) have been under public pressure to limit hatespeech and hate groups active in their communities, especially white supremacist and fascist groups. Most of their response has involved deplatforming (banning users) and demonetization (disabling advertisements for content so users can’t profit off of questionable speech). This is usually seen as a broadly good thing because it cleans up the community and removes the most dangerous and toxic members. Most of the debate circles around which users should be deplatformed or demonetized and whether platforms are doing enough, and why platforms are disincentivized from acting, and the odd role of cultural censor this puts private companies in.
However, deplatformed users don’t simply disappear. Those people still exist, and still want to produce content and regain their source of income. So where do they go when they’re exiled from mainstream social media?
Alt-Social Media
Unsurprisingly, banned alt-right users have flocked to a number of alternative social media platforms. Minds stepped into Facebook’s shoes, Voat is a clear clone of Reddit, Gab stands in for Twitter, and BitChute serves as alternate YouTube. Importantly, these platforms don’t advertise as being havens for the alt-right or neo-nazis; they all self-describe as bastions of free speech that take a hands-off approach to moderation. Whether this is a cover story or the platforms are innocent and have been co-opted by exiled horrible people is up for some debate, but doesn’t change the current state of their communities.
Alternative communities face the same user-acquisition problems the mainstream platforms had when they were young: The point of social-media is to be social, and you can’t build a social community without a lot of people to talk to. The network effect is important here; most alternative social networks will fizzle out quickly because nothing interesting is happening there (and we’ve seen that most Reddit clones have stuttered to a halt within a year or so), but successful social networks will attract more and more people, creating a more vibrant community and attracting even more users, amplifying the effect in a feedback loop. Centralization is natural here. It’s a basin of attraction if you want to use system science terminology.
External influence is also important for selecting which alternative communities will thrive. When a major celebrity like InfoWars is banned from YouTube, they carry their substantial following with them, and whatever platform they land on will receive an explosion of accounts and activity.
The Radicalization Problem
On mainstream platforms the alt-right needed to take a careful stance. They want to express their ideas to recruit others, but have to “behave” and stay within acceptable language for the platform and self-censor. When a popular post contains something hateful, the comments are filled with detractors explaining why they’re wrong and offering countering-views.
On alternative platforms these limitations vanish. Content producers can advocate for race war or genocide or fascist dictatorship or whatever flavor of abhorrent views they hold, without repercussions from the platform. For the most part the only people that join the alternate platform were either banned from mainstream platforms or followed content producers that were, creating a magnificent echo-chamber. Because of the network effect, these users converge to a handful of alternative platforms and all meet one another. Under group-grid theory these platforms would be classified as enclaves - not much social hierarchy, but a clear sense of in-group and out-group and shared attitudes.
Obviously, the content producers on alternative platforms have a smaller reach than on mainstream platforms. However, the intensity of their rhetoric increases dramatically, and so, perhaps, does the threat of radicalization. Deplatforming hateful users from big platforms “cleans up” those platforms, but does it potentially fuel violence by cutting the audience off from counter-viewpoints?
The role of alternative social platforms in radicalization is difficult to measure, and is confounded by other communities like image boards and Discord and Telegram groups. What we know is that incidences of alt-right violence are increasing, and many shooters are active on alt-right media platforms, of either the more private Telegram and 8Chan variety or the more public BitChute flavor. What we can say most confidently is “there may be dangerous unintended consequences of deplatforming that should be investigated.”
Solutions?
If deplatforming is dangerous, what alternatives exist?
More Deplatforming
An obvious answer is to increase deplatforming. If we pressured Twitter and Facebook to deplatform harmful users, then we can pressure hosting and DNS providers to delist harmful communities. This has precedence; after a terrible series of shootings by 8Chan members, Cloudflare terminated service for the 8Chan image board. The board is back online, but only after finding a more niche domain registrar and hosting provider Epik, known for supporting far-right sites. Epik was in turn shut down by their own backend hosting provider, who wanted nothing to do with 8Chan, and only came back online after Epik agreed to only provide DNS services for 8Chan. The site is now hosted by a Russian service provider.
This highlights both the successes and limitations of deplatforming. Through collective agreement that a site like 8chan is abhorrent we can pressure companies to stop cooperating, and we can make it very difficult for such communities to operate. However, once a site is committed to using alternative services to stay operational, they can move to increasingly “alternative” services until they find someone willing to take their money, or someone with resources and an agreeable ideology. Deplatforming pushes them away, but they always have somewhere further to go.
De-recommending
The opposite strategies is to let the alt-right remain on mainstream platforms, but find alternative means to limit their influence and disperse their audience. A key piece of this strategy is recommendation algorithms, responsible for selecting similar YouTube videos, relevant search results, and prioritizing content on a feed. These algorithms can be amended to lower the relevance of alt-right content, making it less likely to be stumbled upon and suggested to fewer people. If the content producers still have a voice on the mainstream platforms then they will be disinclined to leave for a small alternative soapbox with a miniscule audience, and they may not even know that their content is de-prioritized rather than unpopular.
An important consideration: Changes to recommendation algorithms are fraught with challenges, and place more authority in the hands of media platforms, who would be increasingly responsible for shaping culture through mysterious and unobserved means.
Counter-Suggestions
Social Media platforms have been unusually quick to combat misinformation about COVID-19 during the ongoing pandemic. At any mention of COVID, YouTube includes links to CDC and World Health websites with reliable information about the state of the disease. This protocol could be expanded, linking to the Southern Poverty Law Center or Anti-Defamation League or other positive influences at mentions of hate trigger-phrases.
Is this strategy effective? Does it combat hateful views as well as misinformation? Could countering misinformation help prevent the formation of some hateful views to begin with? This is an ongoing research area. One benefit of this strategy is that it can be deployed widely; attaching an SPLC link just below a video title does not deplatform the uploader, and does not need to carry the same weight as making decisions about censorship.
Federating
Both de-recommending and counter-suggestions place more authority in the hands of platforms and see them as the arbiters who decide which cultural problems must be addressed. Detractors to this idea regularly suggest moving to decentralized platforms like Mastodon and Diaspora. In federated social networks, users have a “home” on a particular server, which has its own rules of conduct and permitted content. Servers can interact with one another, agreeing to bridge content between servers and further its reach (a kind of dynamic collaboration loosely reminiscent of connections between Pursuances). In theory this provides a more organic solution to censorship, where everyone is allowed to exist on the federated platform, but if their content is unsightly then it won’t propagate far.
Unfortunately, in practice these federated platforms have suffered from low membership and high centralization, both as a consequence of the network effect. Projects like Mastodon and Diaspora have good intentions and intriguing designs, but without a large community they cannot attract members from Twitter and Facebook, and so mainstream platforms remain viable recruiting grounds for alt-right spaces. Further, running your own federated server within one of these platforms suffers from the same network effect, and frequently leads to centralization on a small number of servers. I wrote about this very briefly a few years ago, and the problem has persisted, to the point that more than half of Mastodon’s users are on three federated instances.
Almost exactly one year ago we witnessed a case study in how federated platforms can handle censorship, when Gab rebuilt itself as a Mastodon instance. The response was positive: Most server operators promptly blocked Gab, isolating its instance on the network. Gab can use the Mastodon code, but not its community. This suggests that federated social networks could be an effective solution; if they can grow their populations.
Splintering a Pursuance
Posted 5/22/20
The primary goal of the Pursuance Project that differentiates it from any other group-based task-management software is the emphasis on organic collaboration, and the trivial creation of new Pursuances that allow complex information flow and rapid organization. That’s buzzwordy, so in a practical sense “it’s really easy to make new organizations and working groups, and split a working group off into a new organization”.
I’ve written in some previous posts about the proposed role system for Pursuance, and how to create collaborations between Pursuances built on top of the role system and using “tasks” as a basic unit that can have attached discussions and can be assigned and referenced between Pursuances. This post will center on ways to create Pursuances more organically than by creating a new blank Pursuance and inviting users in.
As a very quick review, most online collaboration works through shared membership, where one or more individuals are a part of two organizations (or an honorary part of one to facilitate collaboration), and “bridge the gap” between both groups:
This has a moderate startup cost - it’s easy to introduce the new person and add them to some group chats, but you need to bring them up to speed on how the organization operates, add them to Google Docs, Signal, wikis, Keybase, or whatever other infrastructure the group uses. This setup is also brittle, because if the “bridge” members become inactive or leave then the collaboration promptly falls apart. Adding a new user to replace the missing bridge requires repeating much of the same onboarding process, and as membership shifts in both organizations it is easy to lose touch over time.
In the Pursuance model we hope to create a link at an organizational level, that allows sharing tasks, messages, and documents together without sharing members:
More formally, a collaboration exists as a shared agreement between a role in each Pursuance, such that members within a role in one pursuance may assign tasks to a role in another pursuance:
This has the benefit of granting each Pursuance autonomy: Each group can have whatever internal structure they want, and whatever membership turnover works for them, and as long as the roles involved in collaboration still exist the groups can continue to interact in this shared context.
Sometimes, however, collaboration can turn into something more. A collaborative project may split into a Pursuance all on its own, that may even outlive the two parent groups. This is natural and acceptable, and the platform should support such shifting bureaucracy.
To enable this kind of growth, we need to expand our concept of how collaboration works. Imagine that two Pursuances (in this case, the Pursuance Project itself and Distributed Denial of Secrets, which worked together on #29Leaks) want to begin a large collaborative project. We know this project is going to get pretty complex and will involve collaboration with several outside individuals (like journalists) that aren’t part of either original group. This project sounds bigger than just a collaboration between two groups: It’s going to need roles and collaborative agreements of its own. This project sounds more like a Pursuance. So let’s create a new Pursuance with agreements with each of its parent pursuances:
organizer {
	assign tasks technical
	accept tasks 29leaks@ddosecrets
	invite journalist
}

technical {
	accept tasks organizer
	accept invite engineers@pursuance-project
	accept invite sysadmins@ddosecrets
}

journalist {
	accept invite relations@pursuance-project
	contact organizer
	contact technical
}
This looks something like the following:
This creates an interesting arrangement: 29Leaks is an independent Pursuance that can create its own rules and roles, and 29Leaks organizers can invite journalists directly into the project. However, the edges of this Pursuance are permeable in that technical staff from either the Pursuance Project or DDoSecrets can volunteer themselves and automatically join the technical role of 29Leaks, the facilitating “29leaks” role in DDoSecrets can assign tasks to the 29Leaks organizers, and the public relations group from the Pursuance Project can directly add relevant journalists to the journalists role within 29Leaks. This means that while 29Leaks is an independent entity with its own structure it is also trivial to communicate with the two original Pursuances.
Imagine a scenario where 29Leaks continues to operate long into the future. It has accumulated collaborations with several other groups, and it is no longer appropriate to consider this a “child project” of DDoSecrets and the Pursuance Project. Maybe 29Leaks continues to accept technical support from DDoSecrets, but is otherwise fully independent. The administrators of 29Leaks with the founders role may amend the rules to:
organizer {
	assign tasks technical
	invite journalist
}

technical {
	accept tasks organizer
	accept invite sysadmins@ddosecrets
}

journalist {
	contact organizer
	contact technical
}
And the organization now looks like:
In this way, Pursuances can grow and adapt over time, becoming independent entities or folding into other larger Pursuances. When a Pursuance no longer serves a useful purpose it can be discarded, and active members will have adopted new roles in other Pursuances. Thus, even as the people and groups involved shift, activism moves forward.
Memory: Allocation Schemes and Relocatable Code
Posted 4/26/20
This Spring I’m a graduate teaching assistant for an operating systems course. Campus is closed during the COVID-19 epidemic, so I’ve been holding office hours remotely and writing up a range of OS explanations. Below is one of these writeups for a recent topic of some confusion.
There are, broadly, four categories of memory allocation schemes that operating systems use to provision space for executables. This post will discuss each of them in historical order, with pros and cons, and some executable formats (relocatable and position-independent code) that are closely intertwined. We’ll include shared memory and dynamic libraries at the end. Note that we are not talking about malloc and free - the way an application allocates and deallocates memory within the space the operating system has already assigned it - but the way the operating system assigns memory to each program.
1: Flat Memory Model / Single Contiguous Allocation
In a flat memory model, all memory is accessible in a single continuous space from 0x0 to the total bytes of memory available in the hardware. There is no allocation or deallocation, only total access to all available memory. This is appropriate for older computers that only run one program at a time, like the Apple II or Commodore 64. If a program needs to keep track of which memory it’s used then it may implement a heap and something like malloc and free within the memory range. However, if we want to run multiple programs at the same time then we have a dilemma. We want each program to have its own memory for variables, without stepping on one another. If both programs have full access to all the memory of the system then they can easily and frequently write to the same memory addresses and crash one another.
2: Fixed Contiguous Memory Model
Enter our second model, designed explicitly for multi-process systems. In this model, memory is broken into fixed-length partitions, and a range of partitions can be allocated to a particular program. For example, the following is a diagram of memory broken into 40 equally-sized blocks, with three programs (marked A, B, and C) running:
AAAAAAAAAA
AA........
..BBBBBBB.
...CCCCC..
When a program starts, the operating system determines how much memory it will need for static variables and the estimated stack and heap sizes. This is usually a guess based on the size of the executable file plus some wiggle room, but in older operating systems you could often override the system’s guess if you knew the executable required more memory:

Once the operating system determines how much memory is needed, it rounds up to the nearest partition size and determines how many blocks are required. Then it looks for an area of unallocated memory large enough to fit the executable (using one of the algorithms described below), assigns those blocks to the executable, and informs the executable of where its memory begins (a base address) and how much memory it can use.
Since we can only assign an integer number of blocks, there is always some waste involved: A program requiring 1.1 blocks of space will be assigned 2 blocks, wasting most of a block. This is called internal fragmentation.
First-Fit
In the simplest algorithm, the operating system scans memory for the first open space large enough to fit the new program. This is relatively quick, but often leads to poor choices, such as in the following scenario:
AAAAAAAAAA
AA........
..BBBBBBB.
...CCCCC..
We have a new program ‘D’ that we want to start running, which requires three blocks worth of memory. In a First-Fit algorithm we might place ‘D’ here:
AAAAAAAAAA
AADDD.....
..BBBBBBB.
...CCCCC..
This suits D’s purposes perfectly, but means we have reduced the largest free memory space available, so we can no longer fit programs larger than 7 blocks in length.
Next-Fit
The first-fit algorithm also uses memory unevenly - since it always searches memory from 0x0 onwards, it will prefer placing programs towards the start of memory, which will make future allocations slower as it scans over a larger number of assigned blocks. If we keep track of the last assigned block and search for new blocks from that point, the algorithm is called next-fit, and is a slight optimization over first-fit.
Best-Fit
In the “Best-Fit” algorithm we scan all of memory for the smallest unallocated space large enough to fit the program. In this case we would allocate ‘D’ here:
AAAAAAAAAA
AA........
..BBBBBBBD
DD.CCCCC..
This is better in the sense that we can still fit programs of 10 blocks in size, but there’s a downside: The space immediately after ‘D’ is only one block long. Unless the user starts a very small 1-block executable, this space will be effectively useless until either process ‘D’ or ‘C’ exits. Over time, the best-fit algorithm will create many-such holes. If there is sufficient total space for a program, but no unallocated region is large enough to load it, we use the term external fragmentation.
Worst-Fit
“Worst-Fit” is something of a misnomer and should be thought of as “the opposite of best-fit”. In worst-fit we find the largest unallocated memory space, and assign the first blocks from this region to the new program. This avoids the external fragmentation problems of the best-fit algorithm, but encounters the same problem as our first-fit example: A larger program will not have space to run, because we’ve been nibbling away at all the largest memory regions.
Relocatable Code
In order to implement any of these memory allocation schemes, we must be able to tell programs where their variables may be placed. Traditional flat-memory executables use absolute addressing, meaning they refer to variable locations by hard-coded memory addresses. In order to run multiple processes concurrently we need to redesign the executable format slightly to use some kind of offset table. When the program starts, the operating system fills in the true locations of variables in this table, and programs refer to variable locations by looking them up in this table rather than hardcoding the absolute variable locations in. This ability to have executable code run at any starting address in memory is called relocatable code. The exact implementation details of relocation are platform-specific.
As a side-note, we also use relocatable code during the compilation of executables. Object files (.o files) are parts of a program that have been compiled, but not yet linked to one another to create the final executable. Because of this, the final locations of variables are not yet known. The linker fills out the variable locations as it combines the object files.
Defragmentation
Obviously when a program exits we can reclaim the memory it used. Why can’t we move executables while they’re running? Specifically, why can’t we go from:
AAAAAAAAAA
AA........
..BBBBBBBD
DD.CCCCC..
To a cleaner:
AAAAAAAAAA
AABBBBBBBD
DDCCCCC...
..........
This would give us all the room we need for large executables! Unfortunately even relocatable executables aren’t this flexible - while they are designed to be started at any memory location, once the program is running it may create pointers to existing variables and functions, and those pointers may use absolute memory addresses. If we paused an executable, moved it, rewrote the relocation table, and resumed it, then many pointers would be invalid and the program would crash. There are ways to overcome these limitations, but when we get to virtual memory the problem goes away on its own.
3: Dynamic Contiguous Memory Model
The dynamic contiguous memory model is exactly the same as the fixed contiguous memory model, except that blocks have no fixed, pre-determined size. We can assign an arbitrary number of bytes to each executable, eliminating internal fragmentation. This adds significant overhead to the operating system, but from an application perspective the executable is similarly given a starting position and maximum amount of space.
4: Virtual Memory
The modern approach to memory allocation is called virtual memory. In this system we create two separate addressing modes: logical addresses, which are seen by the executable, and physical addresses, which are the true locations of variables seen by the operating system. Whenever the executable reads or writes any memory the operating system translates between the userspace logical address and the physical memory address.
Adding a translation layer before every memory access adds massive overhead - after all, programs read and write to variables all the time! However, there are a number of tempting advantages to virtual memory, so as soon as computer hardware became fast enough to make implementation feasible, all major operating systems rapidly adopted it.
First, we lose the requirement that program memory be contiguous: We can present a userspace program with what appears to be a contiguous memory space from 0x0 to its required memory amount, but when it accesses any address we translate to the true physical location, which can be split up across any number of memory pages. External fragmentation is vanquished!
Further, there’s no reason a logical memory address has to map to any physical memory address. We can tell every executable that it has access to a massive range of memory (4 gigabytes on 32-bit systems, since that’s the range a 32-bit pointer can describe), and only map the pages of memory the executable actually accesses. This means we no longer have to calculate how much space an executable needs before it starts, and can grow as demands change.
Obviously if we offer every executable 4 gigabytes of memory and many take up that much space then we’ll quickly run out of real physical space. Virtual memory comes to the rescue again - we can map a logical address not to a physical address in RAM, but to a location on the disk drive. This lets us store memory that hasn’t been accessed in a long time (known as swap), freeing up space for new programs, and letting us dramatically exceed the true amount of RAM in a system.
Shared Memory
Virtual memory adds a lot of complexity to the operating system, but in one area things are much simpler. Shared memory is when two or more programs have access to the same region of memory, and can each read or write to variables stored inside. With virtual memory, implementing shared memory is trivial: Since we’ve already decoupled logical and physical memory addresses, we can simply map space in two different programs to the same physical region.
Shared/Dynamic Libraries
We can re-use shared memory to implement shared libraries. The idea here is that common pieces of code, like compression or cryptography libraries, will be needed by many programs. Instead of including the library code in every executable (a practice called static linking), we can load the library once, in a shared memory location. Every executable that needs the library can have the shared code mapped in at runtime. This is referred to as dynamic linking.
On Windows, dynamically linked libraries (DLLs) are implemented using relocatable code. The first time a library is loaded it can have any logical address in the first program that uses it. Unfortunately, relocatable code has a severe limitation: the code can only be relocated once, at program start. After that, any pointers to variables or functions will contain their absolute memory addresses. If we load the DLL in a second program at a different logical address then all the pointers within the library will be invalid. Therefore, Windows requires that DLLs be loaded at the same logical address in all executables that use it. Windows goes to great lengths to ensure that each library is loaded at a different address, but if for some reason the address is unavailable in an executable then the library cannot be loaded.
Unix and Linux systems implement shared libraries without the restrictions of relocatable executables. To do this, they have restructured the code in libraries once again…
Position-Independent Executables
Position-Independent Executables (PIE) can be loaded at any location, without a relocation table or last minute rewriting by the operating system. To accomplish this feat, PIE code uses only pointers relative to the current instruction. Instead of jumping to an absolute address, or jumping to an offset from a base address, PIE executables can jump only to “500 bytes after the current instruction”. This makes compilation more complicated and restricts the types of jumps available, but means we can load a segment of code at any location in memory with ease.
Modern Unix and Linux systems require that all shared libraries be compiled as Position-Independent Executables, allowing the operating system to map the library into multiple executables at different logical addresses.
Wrapping Up
Modern operating systems implement virtual memory, allowing them to run many executables concurrently with shared memory and shared libraries, without concern for memory fragmentation or predicting the memory needs of executables. I’ve focused this post on memory allocation from an application perspective, with little regard for hardware, but the implementation details of memory allocation schemes (such as block or page size) are often closely tied to the use of size and number of physical memory chips and caches.
As a final note, virtual memory suggests that we can switch back from relocatable code to absolute addressing, at least outside of shared libraries. After all, if the operating system is already translating between logical and physical addresses, then can’t we use absolute logical addresses like 0x08049730 and let the OS sort it out? Yes, we could, but instead all executables are compiled using either relocatable code or position-independent code, in order to implement a security feature known as Address Space Layout Randomization (ASLR). Unfortunately, that’s out of scope for this post, as explaining the function and necessity of ASLR would require a longer crash-course on binary exploitation and operating system security.
Lambda Calculus: A gentle introduction and broader context
Posted 3/22/20
I TA’d a course on programming languages in Fall 2019, and consistently got questions about lambda calculus. The most important questions weren’t about the mechanics and grammar, but the bigger picture: “Why are we expressing programs in this convoluted and tedious way? What’s the point? What’s all of this for?” This post will address those broader concerns, provide a crash course in lambda-calculus thinking, and hopefully put lambda calc in context.
Lambda calculus is the smallest, simplest version of a programming language we can come up with. We can prove that we can do all kinds of things in lambda calc, even if it’s very tedious and unpleasant. Then we show that if we can implement a lambda calc interpreter in a given language (like Python), that language must be able to do everything that lambda calc can do. In this way lambda calculus is similar to Turing machines, in that if a language can simulate any arbitrary turing machine then it is “turing-complete” and can do everything turing machines can do.
We’ll do a brief example of the idea, without using lambda calculus syntax, which has a bit of a learning curve.
Lambda Calc: Functions
In lambda calculus we have functions that take exactly one argument. There are no variables except constants, no functions of multiple arguments, no constructs like lists or tuples or objects. Just functions of one argument, and some rules about how variable scope works. However, functions are able to create and return other functions.
If lambda calc had a concept of numbers and addition (it does not, but we can create such things) a Python-like syntax might look like:
def add(x):
        def add2(y):
                return x + y
        return add2

# Equivalent lambda-calc syntax
# \x.\y.x+y
We can now use the above like (add(2) 3) to add 2 and 3 and get back 5. This is obviously logically equivalent to a function of two arguments, like add(2, 3). Therefore, we’ve simulated functions of multiple arguments using only functions of one argument.
Lambda Calc: If-statements
Next let’s define true and false and build an if-statement, since we can’t express a lot of important logic without an if-statement.
def true(a):
        def true2(b):
                return a
        return true2

def false(a):
        def false2(b):
                return b
        return false2

# Equivalent lambda-calc syntax
# True:  \a.\b.a
# False: \a.\b.b
If we think of these as functions with two arguments, true(a,b) always returns the first argument, and false(a,b) always returns the second argument. This seems like an awkward definition, but it comes in handy when we define an if-statement:
def if_then_else(boolean):
        def if2(true_path):
                def if3(false_path):
                        return (boolean(true_path) false_path)
                return if3
        return if2

# Equivalent lambda-calc syntax
# \p.\a.\b.p a b
We can think of this as a function that takes three arguments, where the first argument is either “true” or “false”, using our previous definition. The usage works like this:
if_then_else(true, 1, 3) returns 1
if_then_else(false, 1, 3) returns 3
Okay, that looks a little more familiar! The internal representation of true/false might still feel strange, but now we have functions with multiple arguments, and we have if-statements. This language is already a lot more useful than what we started with.
Lambda Calc: Lists
Let’s tackle something more complicated: Building a list. We’ll start a little smaller and build a pair, like (2,6):
def mkpair(a):
        def mkpair2(b):
                def access(first_or_second):
                        return ((if_then_else(first_or_second) a) b)
                return access
        return mkpair2

# Equivalent lambda-calc syntax
# \a.\b.\c.c a b
In plain English, this says “take three arguments. If the third argument is true, return the first argument. If the third argument is false, return the second argument.” We’ll use “true” and “false” as the third parameter to accomplish (2,6).first or (2,6)[0] depending on the kind of language you’re used to writing in. We can even write some helper functions to make this interface friendlier:
def first(pair):
        return (pair true)

def second(pair):
        return (pair false)

# Equivalent lambda-calc syntax
# First:  \p.p (\a.\b.a)
# Second: \p.p (\a.\b.b)
Now we can use pairs like:
def addAPair(pair):
        return (add(first pair)) (second pair)

def createAndAddPair(x):
        def createAndAddPair2(y):
                return addAPair( ((mkpair x) y) )
        return createAndAddPair2
A lot of parenthesis to sort out, but by only passing the first two arguments to mkpair (i.e. ((mkpair 2) 6)) we create a pair of elements, and we can call first or second on this pair to extract the two halves. Great!
Now we can generalize to a list of arbitrary length, by defining a list as a pair of pairs. In other words, we can represent a concept like [1,2,3,4,5] as pairs like (1,(2,(3,(4,5)))). It’s tedious, but we can obviously encode data of any length this way.
What if we want to write a function that can process this list? How can we convey that a list has X elements in it? Well, there are a few design choices we can make. One option is including the length as the first element of the list:
(5,(1,(2,(3,(4,5)))))
This gets a little messy, since any function that’s processing the list will have to peel the first two elements off to get any data, and will have to pre-pend a new first element to update the length, like:
(4,(2,(3,(4,5))))
(3,(3,(4,5)))
(2,(4,5))
(1,5)
Alternatively, we could include booleans at each layer to indicate whether the list has more elements. This might look something like:
(true, (1, (true, (2, (false, 3)))))
This may be easier to work with since we don’t need to continue updating the list length every time we remove an element, but it also requires storing twice as many items to express the data in the list.
Returning to Concept-Land
We started with a language that only contains functions of one variable, and using this concept alone we’ve created functions of multiple arguments, boolean logic, if-statements, pairs, and lists. So much from so little!
This is precisely the reason lambda calculus exists. From an academic perspective, it’s much easier to reason about programming and write formal proofs when the building blocks are small and simple, and we’ve shown you need very little to have a capable programming language.
From an engineering perspective, lambda calculus is a useful concept for thinking about how logic can be translated from one language to another. An imperative language like C or Python works very differently than a functional language like Haskell, or a logic language like Prolog. But if we can express our thinking in C or Python in terms of functions and lists, and we can express functions and lists in lambda calculus, then those same ideas can be expressed in Haskell or Prolog, even if the implementation looks radically different.
Lambda calculus provides a baseline for what programming languages can express, and how ideas can be translated between languages. This kind of thinking (along with lambda calculus’ variable-scoping rules, which we haven’t talked about in this post) form some of the early foundations of compiler and interpreter design.
Consensus Models in the Pursuance Paradigm
Posted 2/9/20
I’ve written a lot recently about defining group dynamics in Pursuance. I’ve outlined a role-based system for describing permissions and responsibilities. So far, however, the role language has been limited to describing rather anarchic systems: Anyone with a role assumes the full powers of the role and can act independently of anyone else with the role. While this is sufficient for describing many organizational structures, especially smaller and short-lived ones, it falls short of describing collective decision making. This post will discuss a few broad categories of collective action, and methods of extending the Pursuance role language proposed in previous posts to describe group decision-making.
Collective Action Styles
Very broadly speaking, there are two categories of group self-governance. In the first, decisions are made by majority vote, as in democracratic and parliamentary systems. There may be varying vote cutoffs depending on the action proposed, and different ways of counting the vote (plurality, ranked-choice, first-past-the-post, …), but the fundamental structure is “the group does whatever the most people want.” There’s a lot of complexity, advantages, and drawbacks of various parliamentary-like systems, but they’re out of scope for this post. Our goal is to enable groups to choose their own organizational structure and define it within Pursuance.
In the second category, decisions are made by global consensus. This can mean that the entire community votes on all decisions, but more commonly the group delegates decisions on certain topics to sub-groups who obtain internal consensus, as in Clusters & Spokes Councils.
Collective Role Permissions
We can describe collective action with a simple language primitive. Here we describe a “member” role, where users holding this position can kick any other member if they can get two additional members to agree with them:
member {
    consensus 3 {
        kick member
    }
}
We can also describe consensus as a percentage of the users holding the role. Here we create a journalist role, where all journalists can agree to bring another into the fold:
journalist {
    consensus 100% {
       invite journalist
    }
}
Group Decision Interface
What does consensus look like in the UI of a platform like Pursuance? It can appear like another task, only visible to users within the role making the decision, with an added function of “approve/disapprove”. Unlike normal tasks, which are closed when someone with the authority to ends it, decision tasks are closed automatically when enough users vote to approve or dissaprove the decision.
Since group decisions are implemented as tasks, they implicitly provide a discussion space about the decision being made.
If blind voting is desired, we can substitute “secret-consensus” in place of “consensus”. In fact, it might be clearer if the language is “public-consensus” and “secret-consensus” to make the visibility of votes unambiguous at all times.
The proposer is always public, even in secret consensus. This is akin to someone calling for a vote of no-confidence: The votes may be secret, but someone publicly called for the vote. This is beneficial because it prevents an abusive scenario where one person creates hundreds of secret consensus actions and grinds the structure to a halt.
A Tiny Parliament
Below is a miniature social structure for a parliamentary organization with two office positions and a role for general body members:
president {
   # Presidential powers here
   unassign role president
}

treasurer {
	# Treasurer powers here
	# Maybe the role has no powers, and exists to provide 0auth access to
	# budget spreadsheets and financial accounts
}

member {
   consensus 50% {
       assign role president
       assign role treasurer
   }
   consensus 90% {
       unassign role president
   }
}
Via a 50% vote of all general members, the membership can elect a new president or treasurer. With a 90% consensus, members can pass a vote of no-confidence and evict a president.
A Tiny Consensus Group
An organization more akin to the Quakers or Occupy Wall Street, with an affinity for clusters and spokes councils, may want to distinguish operations any member can do, and operations only total consensus can achieve:
press-committee {
    # Has the right to represent the organization to the outside
}

member {
   consensus 100% {
       assign role press-committee
   }
   unassign role press-committee
}
In the above system, the entire community must agree to add a member to a committee with higher authority, and any member can revoke that user’s privileges, ensuring the total membership consents to the decisions being made by that committee.
Ongoing Work
The consensus model outlined above has clear limitations. There’s no room for decisions requiring consent from multiple roles. The way a proposal is rejected is a little unclear unless we use percentages (does a consent 3 fail if any 3 members reject the proposal? Does it only fail when enough users reject the proposal that there are not 3 remaining that could pass the proposal?). Nevertheless, this relatively simple proposal dramatically increases the types of organizations we can represent, and therefore what kinds of groups can effectively organize on Pursuance.
The Soviet Cybernetic Economy
Posted 1/30/20
The Soviet Union designed and redesigned a national computer network that would deliver all economic information to a central database, input it into a feedback loop cybernetic economic model, and make autonomous decisions about resource allocation and production subject to broad objectives set by party leadership.
So that’s a fun opening. A 2008 paper titled “InterNyet: why the Soviet Union did not build a nationwide computer network” details the early 1960’s project, with an emphasis on the social history and political context in which it was ultimately crushed. In this post I’ll write briefly about the project, my own take-aways from the paper, and how this informs related ongoing efforts like the Pursuance Project.
The Academic Field
Cybernetics classically* refers to a study of communications and automatic control systems, usually recursive feedback loops where the output or result of the system is also an input determining the further behavior of the system. This study of recursive systems refers both to artificial constructs, like a thermostat using the temperature to determine whether to activate the heater to adjust the temperature, and living constructs, from ecological self-regulation between predators and prey, to societal behavior.
On the Eastern side of the Cold War, cybernetics was particularly applied to economics, and the creation of computer models where a combination of economic output and public demand drives economic creation.
* The modern understanding of cybernetics referring to cyborgs and biotechnology is derived from classical cybernetics, but is quite distinct.
The Communist Opportunity
One of the primary differences between communism and other political theories is a public-controlled economy. Rather than independent corporations choosing what to produce and in what volumes, a government agency (ostensibly representing the will of the people) assigns resources and quotas, and the factories produce what the state requests. This model is frequently imagined as a centrally-controlled economy (i.e. Moscow decides what is to be produced throughout the Soviet Union), but through most of the history of the U.S.S.R. there were a number of agencies based on either physical location or shared industry that directed the economy, with little top-level collaboration.
The difficulty is in bureaucratic scale. Ideally, a central agency with perfect knowledge of the public’s consumption and desires, and the resources and production levels across the country, could make mathematically-optimal choices about how much of what to produce where and have economic output far more responsive, with far less waste, than in a capitalist model. After all, competing corporations do not share information with one another about their sales or upcoming production, necessarily leading to conflicting choices and waste. Unfortunately, collecting sales information from every store, manifests from every warehouse, production output from every factory, and collating it at a central governing body takes immense resources by hand. Making decisions based on this information requires a small army of managers and economists. It is no wonder the Soviet Union opted for localizing decision-making, sharing only high-level information between agencies to limit overhead. Then the advent of digital computers and electronic networking promised a chance to change everything.
The Soviet Plan
The Soviet plan* was relatively straight-forward: They had existing cybernetic models for a recursive economy that relied on simulated data, now they have communications technology capable of providing real numbers. Combine the two, and the economic model transforms from a theoretical simulation of academic interest to an active decision-maker, guiding the activities of the entire Soviet economy in real-time.
For the late 60s, early 70s, this was an ambitious plan. Every factory and storefront would need to install a computer and digitize all records. A nation-wide (or at least in major cities and at primary distribution centers) computer network would be installed to send records to a number of central data centers. Communication would run in both directions, so the central computer could send instructions back to the fringes of the community.
Ultimately, however, it was not the technical limitations that doomed the project (remember that the Soviets successfully built space and nuclear programs), but political ones. Turning over all minute economic decisions to the computer would eliminate a wide number of bureaucratic posts - the same bureaucrats that were to vote on the implementation of the system. Power struggles between different ministries ensured the full plan would never be deployed. Instead, each ministry implemented a subsection of the plan independently, digitizing their own records and networking their computer systems, with no cross-networking or any serious attempt at cross-compatibility. The result solidified existing power structures instead of revolutionizing the nation.
* I am dramatically simplifying here by combining several iterations of project proposals from a number of Soviet cyberneticians, economists, and politicians.
Ongoing Dreams
The core mission of the Soviet project was to automate away bureaucracy, enabling coordination and decision-making at a high scale that would be infeasible with human decision makers. The depth of the hierarchy, amount of information involved, and near real-time response constraints make automation an absolute necessity.
This is fundamentally the same mission as the Pursuance Project, albeit with different motivations: Delegate bureaucracy and administration to the machine, to allow the rapid creation of social groups that traditionally have significant starting costs. Automation has an added boon of providing a constant presence when the membership of the organization shifts.
The problem space for Pursuance is comparatively small: We already have the physical infrastructure for collaboration (the Internet), and since most groups are built around clear short-term objectives there is a limited need for long-term sustainability in any bureaucracy created. Critically, Pursuance does not face the brunt of the Soviet political entrenchment; by focusing on the creation of new activist groups we bypass any sense of “replacing” a person, and only augment what is possible.
Cybernetic models provide an opportunity to expand what work we offload to the machine in a Pursuance, perhaps enabling greater community adaptation and automation by incorporating human choices as inputs in feedback loops chosen by the community. This is all speculation for the moment, but worth further examination as the Pursuance design grows.
Pursuance Group Dynamics
Posted 9/9/19
In the past several posts I’ve written about the technical design of Pursuance in terms of the permissions and communications systems, and how this allows collaboration between different groups on the platform.
This post will take a detour to talk about what groups on Pursuance will look like from a social and bureaucratic capacity, and how work can actually be accomplished with the Pursuance platform.
The Anarchist Model of Institutions
A pursuance is a group of people with shared objectives, and a set of methods for accomplishing those objectives. The pursuance exists so long as those methods make sense, and the objectives remain unfulfilled. Then it disbands.
This suggests that many pursuances will be short-lived and highly specialized. This is the goal. A pursuance with a dedicated and simple purpose has less history, simpler bureaucracy, and shorter on-boarding. There are fewer disagreements and greater enthusiasm, because everyone agrees on their shared purpose and has a clear understanding of their role. The infrastructure is too simple to support much corruption or obfuscation, and anyone who becomes disillusioned can leave and join a more aligned pursuance.
Complex actions are enabled by collaboration between several appropriate pursuances, each adding their own expertise. Many individuals will be part of several pursuances, applying their personal talents to different projects they agree with, and facilitating communication and discovery between pursuances.
Drawbacks to the Anarchist Model
We occasionally see structured micro-organizations as described above in in-person temporary communities, such as the Occupy Wall Street working groups. Less frequently, however, do we see such micro-organizations in online space. There are many micro-communities, which can be as simple as creating a chatroom in Discord, announcing a topic, and inviting people. However, these groups rarely have an explicit purpose, methodology, or decision-making process.
Startup costs are hard. Founding a new organization means agreeing on a decision-making and leadership dynamic, whether through formal bylaws or informal consensus. Building out infrastructure like a wiki, document storage, public websites, source code management, or collaborative editors requires significant sysadmin work to set up, and then ongoing bureaucratic work to make everyone accounts on each service, track who should have what access to what systems, and remove members from each service as they leave the group. There is a strong incentive here to re-use existing infrastructure, and avoid fracturing and creating new groups if possible.
Pursuance Lowers Startup Costs
The Pursuance rules and roles system acts as a primitive kind of bylaws, governing who has what rights and responsibilities within the group. If we provide an example library of pursuance rules then the group can select the closest template to their needs, make some edits, and have working “bylaws” in minutes, including a structure for adding, promoting, and removing members within the pursuance. They also have a task-based discussion forum, so their earliest communications and planning needs are met.
For many groups this will be insufficient, and they will need additional services described above like wikis, academic reference management, or document tagging, that are tailored to the group’s specific goals. Providing all of this functionality in Pursuance would be futile and foolish: There are too many needs, and plenty of well-developed tools that serve those specific purposes better. Pursuance itself follows the same philosophy of focusing on specific objectives with explicit methods, and exists only to facilitate collaboration between individuals in volunteer-driven groups.
However, Pursuance can still help with the administration and maintenance of these external services. Many technologies support an authentication system called OAuth, which allows users to login to a service like Twitter, Facebook, or Google, and use that same login to gain access to something like Wordpress, without telling Wordpress your Facebook password. We can make each pursuance role an OAuth provider, and allow system administrators to configure their pursuance’s infrastructure to use a role’s OAuth.
Using Pursuance for OAuth means everyone has automatic access to whatever systems they need, with virtually no trace of bureaucracy. Anyone in the “developers” role has instant access to the pursuance’s gitlab instance. Anyone in “journalists” can edit the wiki. Administrative onboarding has been reduced to inviting the user to the pursuance, then adding them to the appropriate roles. When a user leaves or is removed from a pursuance, they lose access to all infrastructure, immediately, without an error-prone process of deleting their accounts from every website. Since the pursuance rules control who can add people to particular roles, we effectively have enforceable bylaws governing who can add and remove people from different institutional infrastructure. Pursuance graduates from task-management and group discovery, to automating swathes of administrative work within small groups, freeing members to spin up new organizations for their needs and focus on the work at hand.
Pursuance Task Management
Posted 7/23/19
Pursuances are built around specific goals, or “pursuances”, so it makes sense for the Pursuance platform to be task oriented. Because pursuances tackle a wide variety of topics they will do most of their work off the Pursuance platform using more appropriate tools, including wikis, source code management, shared text editors, and file hosting. Pursuance is a place to organize with other activists, and collaborate with other groups. Therefore we will place an emphasis on collaborative task management, leaving the nature of the tasks as generalizable as possible.
The Task Model
GitHub issues, while designed for tracking planned features and known bugs in software projects, work well for general task management. Lets look at how this idea interacts with the user, role, and permissions systems from previous posts.
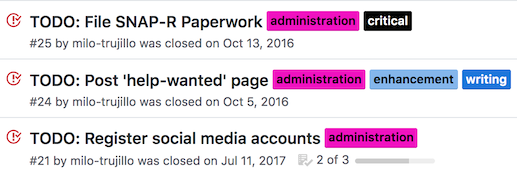
Tasks have a few attributes:
- Title
- Description
- Date created
- Status [Open/Closed, Active/Complete]
- Assigned to: [roles and users]
- Labels
- Conversation thread
Tasks can be assigned to multiple roles and users, by anyone with a role granting them power to assign tasks to another role. For example, anyone in the “leader” role below has power to create tasks and assign them to anyone in “worker” role, or the “worker” role as a whole:
leader {
	assign tasks worker
}

worker {
}
By default, users can only see tasks that are assigned to them or roles they are in. This can be overridden with the cansee permission, such as:
leader {
	assign tasks worker
	cansee tasks worker
}
The above allows leaders to see any tasks assigned to workers. We could allow leaders to see all tasks assigned to anyone with cansee task *.
Task Labels
Tasks can be tagged with labels, defined by the pursuance:
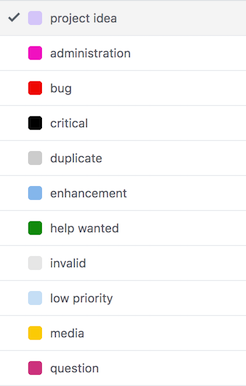
These labels have no structural or rule-based effect (so far), but are searchable, and provide an organizational level more fine-tuned than assigning to roles.
To implement this idea we need two new permissions:
| Attribute | Description |
|---|---|
| assign labels rolename | Can set labels for any tasks assigned to a particular role |
| cancreate labels | Can create new labels for use through the pursuance |
Organizational Examples
We can build a multi-tier moderator setup, where the project leader can designate organizers, who bring in workers and assign tasks to them. Organizers label those tasks appropriately, acting as managers. This might look like:
project-leader {
	cancreate labels
	assign role organizer
	invite organizer
}

organizer {
	contact project-leader
	contact worker
	assign tasks worker
	assign labels worker
	invite worker
}

worker {
	contact organizer
}
(Note that we don’t have to give ‘project-leader’ all the same permissions as ‘organizer’, because anyone that’s a project-leader can simply assign the organizer role to themselves)
We can also create a simpler, more anarchic setup, where every member can create labels and assign them to any task:
member {
	cancreate labels
	assign labels *
	assign tasks *
}
Timelines
Every task has a timeline associated with it, which describes how the task has changed, and includes discussion of the task:
Any user with a task assigned to them (or a role they are in) can comment on a task. They can also close or re-open the issue as they deem appropriate.
This timeline provides a task-based discussion space, organizing the entire pursuance akin to forum threads. This will probably be the primary means of communication for many pursuances, since most discussion will be about particular tasks. By allowing anyone assigned to the task to participate in discussion, we’ve created a private conversation space with only the relevant parties, reducing noise.
Collaboration
A key objective of Pursuance is facilitating collaboration between groups, rather than within groups. Tasks are the main unit for collaboration in Pursuance.
Therefore, tasks can be assigned to roles in other pursuances, so long as those pursuances accept by amending their rules. For example, say pursuances “greenpeace” and “investigating-enron” want to collaborate. Greenpeace might create a role like:
oil-investigators {
	accept tasks environmentalists@investigating-enron
	assign tasks environmentalists@investigating-enron
	assign tasks oil-investigators
}
While “investigating-enron” would add an equivalent role:
environmentalists {
	accept tasks oil-investigators@greenpeace
	assign tasks oil-investigators@greenpeace
	assign tasks environmentalists
}
Now anyone with the “environmentalist” role at the “investigating-enron” pursuance can assign tasks to themselves and the “oil-investigators” role at the “greenpeace” pursuance, and vice-versa. We can provide a graphical tool for “creating a new collaboration role” that fills out rules for a role as above, so users do not have to touch the Pursuance language unless they’re doing something especially clever.
This is more nuanced than two groups assigning work to one another. Since any user with a task assigned to them can add a message to the bottom of the task, we have effectively created a shared forum thread between two distinct communities. Users from each community can participate without previously knowing one another or explicitly adding one another to the conversation. We have an ephemeral, task-oriented, shared communication space for an arbitrary number of communities.
Further, this shared space includes only the relevant people from each community, without dragging in the rest of their infrastructure, making accounts on one another’s services, and so on.
In addition, we can create however many of these spaces are necessary through the creation of additional roles: “Here’s a task with our journalists and your journalists”, “here’s another task with our lawyers and your lawyers.” If additional expertise is needed, either pursuance can add more users or roles to the task, per their own pursuance roles.
Design Concerns
There are a few areas of the above proposal that aren’t fully thought through.
Changing Role and Pursuance Names
The above proposal works if we assume that role and pursuance names are constant. It is simplest to enforce constant names, but what happens if a pursuance is deleted? The collaboration rule no applies. What if a new pursuance is created with the same name as the old one? Does this introduce the possibility of attack through old pursuance rules?
Alternatively, we can use IDs, as in Discord. Internally, a rule would look more like accept tasks oil-investigators@<UUID FOR GREENPEACE PURSUANCE>, and when presented to a human we look up the UUID and substitute the current pursuance name. When the rule is written, a human writes the current pursuance name, and the UUID is substituted in. This allows pursuances to change their names without breaking collaboration rules, and prevents collision if a new pursuance with the same name is created after the old one is deleted.
We cannot use the same solution for roles, because the remote role may not exist yet - in the above example, the oil-investigators role is created before the corresponding environmentalists role is created, or vice-versa. Therefore, the rule no longer applies if the remote role is renamed. However, this may be fine - it allows any pursuance to change which roles are collaborating with which pursuances by changing the role names.
Task Visibility
Above we’ve described a cansee rule allowing different roles to see tasks that are not assigned to them. This makes sense in a larger organizational context, but is it unnecessarily complicated? We could allow all members of a pursuance read-only access to all tasks, and only assigned users and roles receive write-access.
This would simplify the structure of a pursuance, and perhaps make the UI simpler. However, it would also emphasize the use of multiple pursuances to a massive degree. For example, a group may have a “general worker” pursuance and a “trusted contributor” pursuance to create a separation of knowledge and trust.
In my opinion the cansee rule is beneficial, and a pursuance can manage trust and information using roles, and create multiple pursuances for separate broad objectives. This is worth having a discussion over.
How are Users Assigned
When a task is assigned to a role, access rights are clear: Anyone currently possessing the role has read and write access to the task, and if they have the role unassigned then they lose access to the task. If a user is part of multiple roles to which the task is assigned, they retain access unless they are removed from those roles, or the task is unassigned from those roles.
If we assign a task to a particular user within a role, this becomes trickier. Do we only track the user that the task was assigned to, and give them access so long as they are a member of the pursuance? Or do we track which role the user received access through, and automatically revoke their access when this role is removed?
I am a fan of the later, and envision a table for assignments akin to:
| Task ID | user ID | role | Pursuance ID |
|---|---|---|---|
This allows us to track what users received what access via what role in what pursuance, and therefore when a user has a role removed we can unassign all applicable tasks with something like:
DELETE FROM task_assignments WHERE userID=X role=Y pursuanceID=Z;
Remaining Design Work
We now have a vision for what a pursuance looks like (a collection of users given various roles), what the main activity within a pursuance is (creating and assigning tasks, commenting on those tasks), and how pursuances collaborate (through creating shared tasks and inviting relevant parties). We’ve outlined a rule system to facilitate task, user, and role management.
This is a good structure once groups are established, but we’re missing the catalytic step: How do users discover and join pursuances? Inviting users into an existing community is effective only when you have an existing social network to build from, but one of the main objectives of the Pursuance Project is to make group discovery and participatory activism trivial.
Next up: How pursuances can present themselves to new users, and how we can visualize how pursuances are interconnected, and what skillsets are needed.
Pursuance Roles
Posted 7/14/19
Pursuance is a collaboration tool for activists, journalists, and other groups seeking positive change. At the heart of Pursuance is task management, information sharing, and communication, focusing on combining everyone’s unique talents and backgrounds, and adapting to the rapidly changing membership that plagues volunteer groups.
This post is a proposal for implementing roles and rules within Pursuance. It is compatible with, but does not require, the previous post on implementing Pursuance over email. This post is a bare minimum framework, and leaves significant room for expanding Pursuance rules as additional functionality is added to the platform.
Roles
Each user can have multiple roles within an organization, or pursuance. These roles can be used in:
- Messaging (they work like a mailing list)
- Task Assignment (out of scope for this post)
- Pursuance Rules (discussed below)
This idea is inspired by Discord roles:
On this chatroom platform, roles give users read or write access to different channels within a server, and a range of moderator powers including creating new roles and channels. Roles on Discord have an explicit hierarchy, determining which roles can assign which other roles, and what color a username appears in when the user has multiple roles.
We want to take this idea and apply it outside a chatroom, representing more flexible relationships than a simple hierarchy. Specifically we want to represent tree structures of who can contact whom, or community clusters with different expertise for reviewing documents, two use-cases discussed in an overview of Pursuance.
Pursuance Rules
A role is a title, combined with a set of permissions describing what users with the role are capable of. Therefore we need to describe Pursuance rules as we define roles.
Pursuance rules mostly describe what members do and do not have permission to do. What permissions exist?
- Can create and edit roles
- Can assign roles
- Can contact another
- Can invite users to pursuance
- More as Pursuance develops
Initially pursuances have one user, the creator of the pursuance, with the role “founder”. This role has all permissions, thus allowing them to construct the rest of the pursuance as they see fit.
What do Pursuance Rules Look Like?
We need some syntax for describing pursuance rules and roles. Here’s a first attempt describing a document review system, where some journalists need help analyzing a trove of documents, and confer with experts when appropriate:
journalists {
	contact *
	assign role security-experts
	invite journalists
	invite security-experts
}

security-experts {
	contact journalists
	invite security-experts
}
Journalists are allowed to contact anyone, and can invite new members into the pursuance as either journalists or security-experts. They can also designate existing users as security experts.
Security experts can review certain documents on computer security topics. Therefore, they need to be able to communicate their findings back to journalists. They can also invite their peers as fellow security experts. However, they cannot invite users with any other roles, or promote existing users with different roles to security experts.
Creating Rules and Roles
Who can create roles or rules within a pursuance? Initially, only the founder, who has permission to do anything. Do we want to delegate this permission?
At first, delegation seems advantageous - we can allow moderators to refine rules for their community on behalf of administrators, or create regional community leaders who can create new roles for organizing local membership.
However, delegating this authority makes the rule system dramatically more complex. Do we add some kind of limit, like “members with the power to create roles can only give those roles subsets of the authority their own roles have?” What if the user’s permissions change? Does each role have a parent user it receives authority from? A parent role?
That’s a lot of complexity for a use-case that won’t occur often. How large do we expect a pursuance to get? Twenty users? A hundred, for some of the larger communities? How many roles and rules are necessary to administer such a group? Most pursuances will probably be satisfied with five or less roles, and rules that do not change, or rarely change, after group creation. Maybe more roles, if they’re used as simple team labels, but such roles would be boiler plate, used for task assignment and mailing lists only.
Instead, let’s keep this design as simple as possible, and enable complexity through linking pursuances together. Consider a political action group with city, state, and national levels. Instead of creating one massive pursuance with many roles and rules and complex delegation, we can create a tree of pursuances, each with their own organizational structures. Shared members between the groups act as delegates, and allow sharing of information and tasks between pursuances.
From a rule-making perspective, this means we can leave only founders with the power to create and edit roles. If a founder wants to delegate this power, they can appoint other founders.
Common Design Patterns
Expecting everyone to learn a new language to describe their organization’s social structure creates a high barrier to entry, even if the language is simple and easy to learn. Fortunately, this is largely unnecessary.
Instead of starting each pursuance with a blank slate, we can provide a list of organizational templates to choose from. This is pretty similar to what Overleaf does: LaTeX is a complicated language with a steep learning curve, so they provide a library of example LaTeX documents as starting points, dramatically simplifying the process for new users.
Not only does this make Pursuance easier to use, but it provides an opportunity to promote power structures we think are healthy or productive, exposing communities to new ideas.
Below are a handful of simple examples. As we expand the capabilities of pursuance rules, this list should be expanded.
The Chatroom
member {
	contact *
	invite member
}
To make this a moderated chatroom, we can add a second role:
moderator {
	kick member
}
The founder can now designate moderators, who have the authority to kick any member out of the pursuance.
Journalism Crowd-Sourcing
journalists {
	contact *
	assign role handlers
	invite journalists
	invite handlers
	invite sources
	kick sources
	kick handlers
}

handlers {
	contact journalists
	contact sources
	invite sources
	kick sources
}

sources {
	contact handlers
}
This creates a 3-stage filtering system, wherein journalists can recruit sources directly or recruit trusted helpers. Sources can present their findings to any handler, who can forward relevant information to the journalists. Handlers act as moderators, and can kick troll-sources or recruit new sources without interaction from journalists.
Additional Rule Attributes
Everything discussed about roles so far is for describing communication boundaries and recruitment of new users. What other attributes might we want to add? Here are some early ideas:
| Attribute | Description |
|---|---|
| group addressable | Allow users to write to the entire group rather than individuals in it |
| public membership | Make a list of users with this role public (within the pursuance? To people outside the pursuance?) |
| public tasks | Make a list of all tasks assigned to this role |
| description | A human-readable description of the powers and responsibilities of the role |
| cansee tasks X | Can see tasks assigned to role X, or people with role X |
| cansee tasks * | Can see all tasks in the pursuance |
| cansee files foldername | Can see all files in a particular folder |
| canadd files foldername | Can upload new files in a particular folder |
| canadd tasks rolename | Can add new tasks and assign them to a particular role, or users with the role |
Conclusion + Future Work
The role system defined above is pretty primitive, and will likely develop over time. However, this is already enough to describe how different people and groups can collaborate, how new users are added to a pursuance and assigned different roles within the organization, and how privacy is enforced.
By placing an emphasis on roles over users, we give a pursuance some flexibility as membership changes. Still missing is the ability to respond dynamically to membership changes. For example, we could add rules to a role such that when someone leaves the pursuance any tasks assigned to them are reassigned to the role at large, or to a random member within the role. This process can also occur automatically for inactive users. There’s some complexity surrounding which role to assign the task to if the user had multiple roles, but that’s for a later post on task management in Pursuance.
Also missing so far is any mention of how information is formally shared between pursuances - shared membership is sufficient for forwarding an email, and we should leverage informal systems like this whenever they are beneficial. However, it would be ideal if we could describe tasks that cross pursuances. These shared tasks would be assigned to different people in each pursuance, and facilitate task-based communication between pursuances, without explicitly merging the groups.
Pursuance Prototype: Email?
Posted 6/24/19
After my previous post I have an abstract understanding of what the Pursuance Project is trying to achieve. What would the technology itself look like? What existing technologies can we build off of to achieve our goals?
As a refresher, we need:
-
A concept of “users”
-
A concept of a group, which users can be a part of, called a “pursuance”
-
A way for users within a pursuance to message one another
-
A concept of “tasks” that can be assigned to users
-
Shared document storage
-
A “role” system for users, describing their expertise or position in the org
-
A permissions system that can be applied to pursuances, users, or roles, describing:
-
Who can contact who
-
What files can be read/written
-
What new permissions can be granted or revoked
-
Let’s set aside the document storage problem for a moment. The rest of Pursuance is a messaging system, with sophisticated permissions for describing who is allowed to message whom. What existing messaging platforms fit these needs?
We have a few open source messaging technologies to choose from, including IRC, XMPP/Jabber, Keybase (client is OSS, server-side is not), mastadon, and email. Rather than addressing pros and cons of each individually, what do we want out of our chat system?
We want something with an intuitive or familiar UI, and we want something that emphasizes thoughtful communication over banter. This actually rules out most chatroom software like IRC, secure texting replacements like Signal, and Twitter-like platforms like Mastadon. Keybase is attractive due to its inherent encryption, but doesn’t support much in the way of permissions controlling what users can message one another, and is notably a noisy chatroom like Discord or Slack.
What about email? Tools like spam filters control what accounts can email one another all the time, the model is trivially understood by anyone that’s used a computer, and the format is significantly longer-form than text messaging or tweets, hopefully facilitating more thoughtful communication.
Implementation
Let’s say a Pursuance server is running a classic mail stack, like Postfix and Dovecot. This is a closed system, only accepting mail from Pursuance users and refusing to deliver anything externally, so we have a lot more control over configuration.
The Pursuance client can either be a desktop app or a web app with email functionality. It differs from a standard mail client in that it adds the pursuance as an extra mail header (or maybe as the domain, like @pursuance-name?), to track which pursuance two users are communicating through.
Since Postfix and Dovecot can use a database to retrieve lists of users, we can now have a few SQL tables for tracking login information, what users are in what pursuances, what roles users have in each pursuance, and what rules apply to the pursuance.
We can add a filter to Postfix that calls an external script before accepting or rejecting mail for delivery. This script can be arbitrarily complex, querying SQL, parsing pursuance rules, and ultimately choosing whether or not to deliver the message.
Additional Messaging Functionality
Want to send files between users? Email attachments are implicitly supported.
Auto-deletion of old messages? We can set up a pursuance rule that periodically triggers deletion of old emails.
End to end encryption? There are longstanding PGP standards for encrypting emails with a user-supplied keypair. This is usually tedious to set up, because every user has to install and understand tools like GPG - but if we include pre-configured encryption support in the Pursuance client, this is a non-issue. We can use the Pursuance server as a public keyserver (storing the public keys in SQL), or support using a public keyserver for redundancy.
Decentralizing server hosting? This is still a stretch goal, but email between mail servers is obviously an existing standard, and we can build from there.
Task Management
To organize a pursuance we need a concept of tasks that can be assigned to a user or group of users. With heavy inspiration from Github issues, tasks have the following attributes:
-
Task ID
-
Task Name
-
Task Description
-
Task Status (Unassigned, Assigned, Complete)
-
Assigned to Users (list)
-
Assigned to Tags (list)
All of this can be pretty easily described in an SQL table and hooked up to the existing user management database.
File Sharing
We need a large amount of storage space to store all files for all pursuances. Do we use a big hardware RAID like what’s provided by Digital Ocean? Do we use a more conventional cloud solution, like a paid Google Drive plan? The best answer from a software side is to be implementation-agnostic. We have a big folder on the Pursuance server that we can keep things in. How do we manage it?
Let’s store all files with a UUID, in a directory space like storagedirectory/pursuanceID/fileID
Each file has an entry in the database with the attributes:
-
Pursuance ID
-
File ID
-
File name
-
Parent Folder ID
We can simulate a filesystem by adding “folders” to the database with the attributes:
-
Folder ID
-
Parent Folder ID
-
Folder name
We can now apply pursuance rules to folders, creating a permissions system. We can add some kind of REST API like:
GET /directories/:pursuance: - Returns an XML structure describing all folders visible to the user, subject to pursuance rules
GET /file/:fileid: - Returns a file, if the user has permission to access it
POST /fileupload - Uploads a file with specific name to specified folder ID, if user has permission
Conclusion
Most of the Pursuance infrastructure can be implemented relatively easily on the server side, using SQL for tracking accounts, groups, tags, and files, and using email as an underlying messaging technology. There’s a lot to build ourselves, but it’s a lot of pretty simple database and REST API work.
There are two major challenges with this approach:
The Client
We need a pretty sophisticated client, and it’s going to be built largely from scratch. If we build a web-app then we can re-use some pre-existing components (mostly repurposing some webmail client), but that’s still a lot of JavaScript and UI work, well outside my area of expertise. However, this is going to be the case for any approach we take. Even building on top of a platform like Keybase would require making significant UI additions for the rules system and issue tracking.
The Rule System
This is the heart of Pursuance, and what makes it more valuable than “email + Asana + Google Drive”. The rule system deserves a whole design document on its own. Is it a configuration file, with rules written in XML or JSON? Is it a domain specific language? Do we make it text-based and oriented towards programmers and sysadmins? This may be easier to implement and more versatile, but will require a kind of “pursuance specialist” per pursuance to set up the rule infrastructure. Alternatively, do we give it some kind of graphical editor like Snap in an effort to make the rules easily writable for any volunteer?
Once again, the rule system will be a significant obstacle no matter what infrastructure we build Pursuance on. This seems like a feasible design from a first glance.
Pursuance Project Initial Impressions
Posted 6/21/19
I recently had a conference call with several excellent people at the Pursuance Project, a platform facilitating collaboration between users working towards shared social goals, and enabling collaboration between separate or overlapping groups working towards related goals. If that sounds vague, broad, and ambitious, it’s because it is. This is about allowing new power structures over the Internet, with unprecedented flexibility. Let’s look at a few examples to clarify.
Use Cases
The Journalist Pyramid Scheme of Information Flow
Barrett Brown’s first example crystallized the vision for me. A journalist wants to crowd-source information gathering. Unfortunately, getting tips from the public is a high-noise low-signal endeavor: Many people will submit what is already public information, or will submit conspiracy theories and nonsense. Instead, what if the journalist has a handful of trusted contacts, and they charge these contacts with gathering information and filtering the noise before forwarding the interesting tips to the journalist. These trusted contacts find a number of sources of their own, and give them the same mission - gather information, filter the noise, and report the remaining content upstream. This trivially distributes labor so the journalist can talk to a handful of contacts and receive high-quality aggregated information from a large number of sources.
We can add extra features to this system for sending some messages above a filter, to identify incompetent members of the group, or re-submitting tips to random locations in the tree to increase the chance of and speed up propagating upwards to the journalist. The basic premise of distribution of labor remains the same.
The Document Tagging Problem
Another collaborative task featuring journalists: A group has a large number of leaked or FOIA’d documents. They need to crowd-source tagging the documents or building a wiki based on the documents, to summarize the information inside and make content searchable. This is a more sophisticated problem than “filter out gibberish and obvious falsehoods from the messages sent to you”, and involves assigning tasks to individual or groups of volunteers. There may be categories of volunteers (such as specialists that understand certain kinds of technical documents), and different members may have different permissions (only some trusted individuals can delete irrelevant documents). However, the problem is fundamentally similar in that we have groups of volunteers communicating within some kind of hierarchy to prevent the chaos of an unregulated chatroom like Slack or Discord.
Pursuance Objectives
Building a unique platform for each of the above use cases would be wasteful. Each would be relatively obscure, there would be lots of duplicate code, bringing users onto a new platform for a specific project is effort-expensive, and - critically - the two projects may want to interact! What if document taggers in the second use-case are also information sources in the first use-case, feeding information about important documents they find up to a journalist? Instead, it would be better if we had a unified platform for social collaboration of this kind, so users create a single account and can interact with any number of social action groups with ease.
This means that Pursuance cannot be built for a specific type of group, but must be adaptable to many group structures. In fact, the main function differentiating Pursuance from other messaging systems is a language for describing the social framework being used. Build a system that can describe and enforce the structure of the journalist-pyramid, and the document tagging expert-clusters, and other groups will be able to adapt it for a vast number of social needs.
Technical Requirements
What are the bare-necessities for meeting the above two use-cases? We need:
-
A concept of “users”
-
A concept of a group, which users can be a part of, called a “pursuance”
-
A way for users within a pursuance to message one another
-
A concept of “tasks” that can be assigned to users
-
Shared document storage
-
A “role” system for users, describing their expertise or position in the org
-
A permissions system that can be applied to pursuances, users, or roles, describing:
-
Who can contact who
-
What files can be read/written
-
What new permissions can be granted or revoked
-
Some nice-to-haves:
-
End-to-end encryption for messages between users
-
Zero-Knowledge encryption of files, so the hosting server cannot read them
-
Decentralization, allowing different pursuances to host content on their own servers and link them together
Group Discovery
The above structure is sufficient for running organizations with existing users. However, a large problem in activist and non-profit spaces is peer-discovery and avoiding duplication of effort. Pursuance should also provide an easy way to discover other organizations, perhaps by searching for their titles, descriptions, or viewing shared membership. Imagine something as follows:
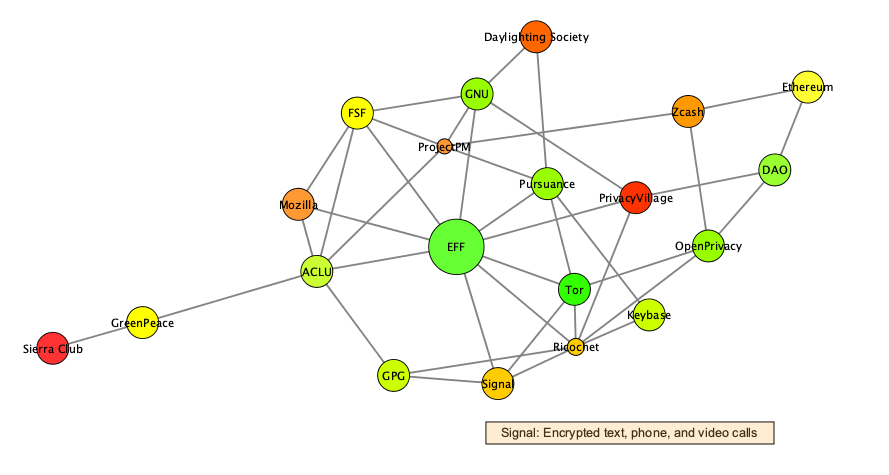
Maybe the circle size is based on the number of participating members, and the color indicates the number of messages sent / number of members in the past 30 days, as a vague indicator of activity. Edges indicate shared membership, pulling collaborating pursuances close on the map. Selecting a pursuance, like Signal, displays an additional description of the group’s purpose.
We need to add the following attributes to a pursuance to achieve this:
-
A pursuance title
-
A pursuance description
-
Some pursuance-level permissions for what information can be shared publicly:
-
Number of members
-
Identity of members?
-
Activity level
-
Messages
-
Files
-
Concluding Thoughts
This is a complicated project. One of the most difficult and important tasks for Pursuance will be making this technology intuitive, and hiding the complexity as much as possible when it is not critical for users to understand. From the perspective of the journalist in the first use-case, we probably want the journalist to see and send messages to their trusted contacts, and that’s all. Let the trusted contacts manage the complexity of the pyramid structure. Perhaps it makes sense for each group to have a “pursuance manager”, much like a sysadmin, who is more well-versed in the technology and manages the rules that make the pursuance tick.
Group-Grid Theory for Classifying Social Groups
Posted 6/13/19
I’ve recently been introduced to Group-Grid Theory, a framework from anthropology for classifying group dynamics and power structures. Let’s examine the model from an interest in intentional community building.
Under Group-Grid theory, communities are described along two axes, predictably “group” and “grid”. Here, “group” means how cohesive the community is, in terms of both clear delineation of membership (it’s obvious who’s a part of the community), and in how group-centric the thinking and policies within the group are. Slightly more complex is “grid”, which represents how structured the group is in terms of both leadership hierarchy and sophistication of / emphasis on rules.
| Group/Grid | Low Grid | High Grid |
| Low Group | Individualism | Fatalism |
| High Group | Enclavism | Hierarchy |
The above four groups are the most extreme corners of the axes - of course any real group will contain attributes along both axes, and land in a gradient rather than discrete categories.
The Four Archetypes
Hierarchy
This is the organizational structure we’re most used to, for organizations like corporations, the military, and student clubs. Membership is explicitly defined by initiation rites including contracts, swearing-in ceremonies, paying dues, and attending meetings.
The organizations not only have well-defined rules, but formal leadership hierarchies like officer positions, defined in bylaws or community guidelines.
When problems occur in these communities, they fall back on rules to assign responsibility or blame, and determine what courses of action to take.
Enclavism
Enclaves are groups without complex, well-defined structure, leadership, or rules, but clearly-defined membership qualities. Examples include communes, families, and other “horizontal” organizations.
These organizations are not without power dynamics, and frequently assign implicit authority based on experience or age. Membership is based on physical proximity (often living together), shared contributions of labor, or shared genetics.
In these organizations, problems are often framed as something external threatening the in-group. Conflict resolution revolves around the in-group collaborating to either deal with the external force, or in extreme circumstances, growing or shrinking the in-group to maintain cohesion.
Individualism
Individualist organizations, as the name implies, have neither strong respect for authority nor clear group boundaries. These can include loose social “scenes” like hactivism or security culture, social movements like Black Lives Matter, or loosely organized hate groups. There are shared attributes in the organization, such as an ethos or area of interest - otherwise there would be no social group at all - but there is minimal structure beyond this.
Membership in these groups is usually permeable and self-defined: What makes someone a part of Anonymous beyond declaring that they are? What makes them no longer a member of that community, except ceasing to speak in those circles and dropping the Anonymous title? As members join and leave with ease, tracking the size and makeup of these groups is extremely challenging.
When these groups face pressure they fragment easily, making multiple overlapping communities to encompass differences in opinion. This fragmentation can be due to disagreements over ideology, hatred or reverence of a particularly person, group, or action, or similar schisms within the in-group. This apparent lack of consistency can in some ways serve as stability, allowing groups to adapt to change by redefining themselves with ease.
Fatalism
Fatalism describes organizations with sophisticated rules and rituals, but no communal behavior or allegiance. One example is capitalism as an ecosystem: There are rules of behavior governing money-making activities, but there is no care given to other participants in the community. In ultra-capitalist models, corporations are cut-throat to both one another and their own employees, prioritizing money-making over community health. Other fatalist groups include refugees, governed by the system of rules in their host country, without being cared-for members of it in the same way as a citizen.
These groups are called fatalist, because there are no tools for addressing conflict: The leadership structure hands down decisions and their effects, and there is little recourse for those impacted. The community holds little power, and has little trust in the benevolence of the grid.
Early Thoughts
The Group/Grid lens illustrates trade-offs between making groups with formal rules and leadership systems, and building a more anarchic self-organized group. It also shows benefits of declaring formal membership criteria and focusing on community-building, or allowing permeable, self-defined membership. Early intuitions are that a focus on community builds a more committed membership, which will be less prone to fragmentation and dissolution. Unfortunately, strong group identity can also breed toxic group dynamics, as members are more invested in seeing their vision realized and more resistant to “walking away” when the group moves in an incompatible direction. Similarly, group hierarchy can be efficient for decision-making, but can alienate the community if applied bluntly. Hierarchy works great at a local level, as with school clubs, where it’s effectively just division of labor. If the grid is no longer operated by the community, then we inevitably reach fatalism, which has extreme drawbacks.
These are sophomoric first impressions, but now I have group-grid as a tool for describing and analyzing groups, and can apply it moving forwards. I’ll probably return to this topic in future posts as it becomes relevant.
Steganography and Steganalysis with Fourier Transforms
Posted 5/8/19
This post is a high-level introduction to hiding messages in images using Fourier Transforms on the color data. This technique is less susceptible to accidental destruction than techniques like Least Significant Bit steganography, while remaining far more challenging to detect than metadata-based approaches like storing secret messages in image comments. No background in steganography or Fourier Transforms is expected. This post is largely based on “Image Steganography and Steganalysis”, by Mayra Bachrach and Frank Shih.
Image Steganography, the Basics
Our objective is to hide secret messages, whether they be text or arbitrary files, inside images. Images are an attractive secret-message envelope, since they can be transferred in a number of ways (texting, emails, posting on forums, sharing through Google Photos, etc), and do not raise suspicions in many contexts. Before discussing Fourier Transform steganography, we’ll talk about some simpler approaches as context.
Most images include metadata for storing various statistics about the image contents. This metadata can be viewed and edited with tools like exiftool:
% exiftool qr.png
ExifTool Version Number         : 11.01
File Name                       : qr.png
Directory                       : .
File Size                       : 9.7 kB
File Modification Date/Time     : 2019:04:27 20:10:55-04:00
File Access Date/Time           : 2019:04:27 20:10:57-04:00
File Inode Change Date/Time     : 2019:04:27 20:10:56-04:00
File Permissions                : rw-rw-rw-
File Type                       : PNG
File Type Extension             : png
MIME Type                       : image/png
Image Width                     : 246
Image Height                    : 246
Bit Depth                       : 8
Color Type                      : RGB with Alpha
Compression                     : Deflate/Inflate
Filter                          : Adaptive
Interlace                       : Noninterlaced
Image Size                      : 246x246
Megapixels                      : 0.061
A first trivial attempt at message hiding is simply putting your secret message in one of these metadata fields. Unfortunately, this is easy to detect with automated tools, as most images won’t have many human-readable strings in them. This data may also be accidentally deleted, as many web services strip image data intentionally, or unintentionally lose it when translating from one image format (like PNG) to another (like JPG).
A slightly more sophisticated solution is Least Significant Bit steganography. The synopsis is:
-
Every pixel’s color is represented as three bytes, for Red, Green, and Blue
-
A change to the least significant bit will result in a nearly-identical color, and the difference will not be perceptible to the human eye
-
We can represent our secret message as a binary sequence
-
We can set the least significant bit of each pixel to the bits from our secret message
Done! And no longer trivially detectable! Even if someone does find your message, it will be hard to prove it is a secret message if it’s encrypted. Unfortunately this method is also susceptible to accidental breaks: If an image is resized or translated to another format then it will be recompressed, and these least significant bits are likely to be damaged in the process.
We want an equally secret message encoding system that is as difficult to detect, but less susceptible to damage.
Fourier Transforms
The math behind Fourier Transforms is complicated, but the intuition is not. Consider a sine wave:
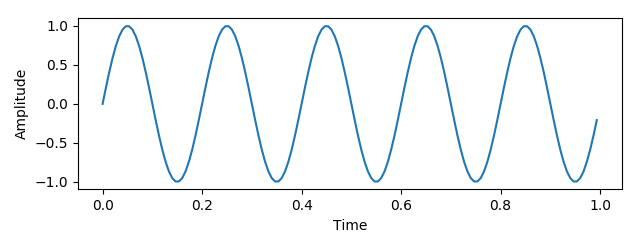
This wave can be described as a frequency and amplitude - let those be x- and y-coordinates in 2-D space:
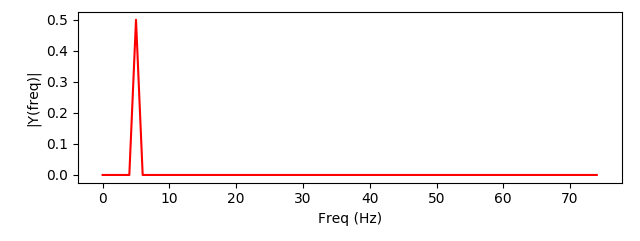
We can add a second wave, with a different frequency:
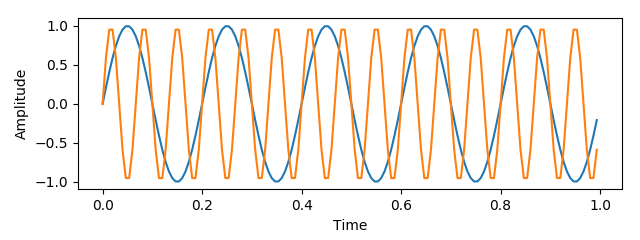
And when we combine the two signals we can represent the combination as two points in frequency-amplitude space, representing the two waves we’ve added:
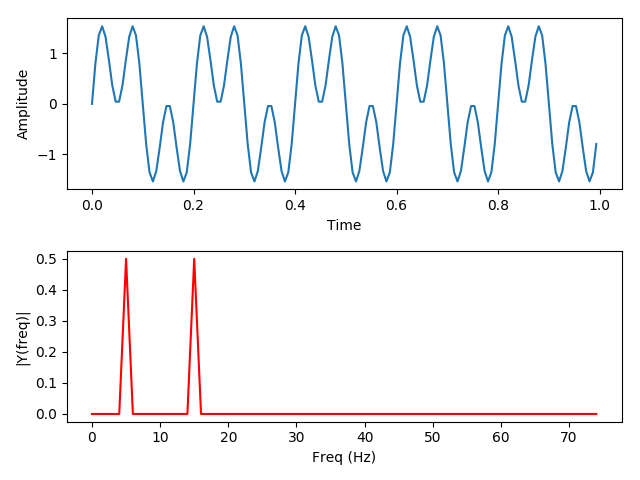
(The code used to generate the above images can be found here)
This leads to three conclusions:
-
Any arbitrarily complicated signal can be represented as a series of sine waves, layered on top of one another
-
A finite-length signal can be represented with a finite number of sine waves
-
The original signal can be reconstructed by taking the constituent sine waves and combining them
The Discrete Fourier Transform is an algorithm that derives these waves, given a signal of finite length described as discrete samples.
Why would we want to represent waves in this way? A plethora of reasons. Noise reduction, by deleting all waves with an amplitude below a specific threshold. Noise isolation, by deleting all waves not within a specific frequency range (such as the human vocal range). Noise correction, by shifting the frequency of some waves (as used in auto-tune). Ultimately, the Fourier Transform is the foundation of much audio, video, and image compression and manipulation.
Converting Images to a Fourier Matrix
The paper is a little hand-wavey on this part, but images can be expressed as a layering of sine and cosine waves with input based on the pixel coordinates. As with the one-dimensional Fourier transforms used in audio analysis, this process can be reversed to reproduce the original image. The number of samples and waves used determines the accuracy of the approximation, and thus the accuracy when inverting the function to recreate the original image. This video goes into further detail on the process, which is commonly used for image editing and compression.
Embedding and Extracting Messages using Fourier Series
Next, the user expresses their embedded message as a Fourier series. This can be done in a variety of ways, from adapting the waveform of an audio message, to encoding text as a bitsequence and solving the Fourier series for that sequence, to simply Fourier encoding a second image. Once the user has a message encoded as a Fourier series they can easily superimpose the signal by adding coefficients to the corresponding polynomials in the image matrix. The matrix can then be reversed, translating from the frequency domain back to the spatial image domain. The effect is a slight dithering, or static, applied to the image. By shifting the frequency of the hidden message up or down the user may adjust the static properties until a subtle effect is achieved.
The steganographic data can be relatively easily extracted given a copy of the original image. Comparing the pixels of the original and modified image can demonstrate that something has been changed, but not a discernible pattern that can be distinguished from artifacting resulting from lossy image compression, such as what one would see by switching the data format from PNG to JPEG. However, by converting both images to their Fourier matrix representation and subtracting from each other, anyone can retrieve the polynomial representing the encoded message. If the message was frequency adjusted to minimize visual presence, it must now be frequency shifted back, before decoding from Fourier to the original format (audio, bitsequence, etc).
If the unaltered image is not available, because the photo is an original rather than something taken from the web, then a simple delta is impossible. Instead, statistical analysis is necessary. Once again, the Fourier transform is critical, as it allows for pattern recognition and signal detection, differentiating between normal image frequencies and the structured data resulting from layering a message on top of the image.
Steganalysis with Fourier Transforms
The same Fourier-delta technique can be used for the more difficult task of detecting and extracting steganography of an unknown format. In this case, we are given an image, and need to establish both whether there is a hidden message, and preferably, what it is. Given an arbitrary image, we first need to establish a baseline. We can perform a reverse image search and find similar images, with an identical appearance but different hashes. We then compare each baseline image to the possibly steganographic image by converting both to Fourier matrices and calculating a delta, as above. We must then perform noise reduction to remove minor perturbations such as image re-encoding and re-sizing artifacting. If the remaining delta is statistically significant, then there is evidence of a secret signal. This completes the first step, identifying the presence of a steganographic message.
Unfortunately, interpreting this identified message is beyond the scope of the paper. Both participants in a secret conversation can pre-agree on an encoding scheme such as audio, bitstrings, or an embedded image. Given only a frequency spectrum, an analyst needs to attempt multiple encodings until something meaningful is produced. Particularly if the frequency-shifting outlined above has been performed, this is an extremely tedious process, better suited (at least so far) to manual inspection and intuitive analysis than a purely automated design.
Infection and Quarantine
Posted 10/23/18
Network Science is a relatively young discipline, which uses a small number of basic models to represent a wide variety of network phenomenon, ranging from human social interactions, to food webs, to the structure of the power grid.
This post focuses on social communities, historically modeled as random networks, where every person has a percent change of having a social connection to any other person. The following is an example of a random network, where the circular nodes represent people, and the edges between circles indicate a social link:
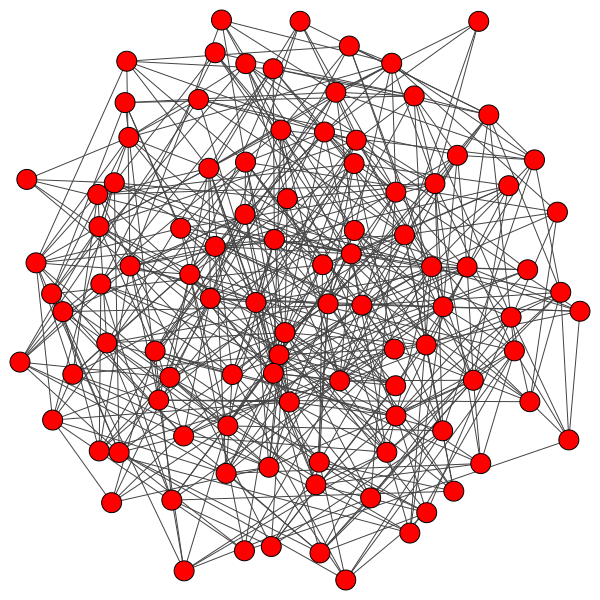
The Topic
Of particular interest to me are information cascades, where some “state” is passed along from node to node, rippling through the network. These “states” can represent the spread of disease, a meme, a political ideology, or any number of things that can be passed on through human interaction.
A starting point for understanding information cascades is disease propagation. Traditionally, infection models run in discrete timesteps, and assume that the infection has a percent chance of spreading across an edge each turn, and will continue to spread until the infected are no longer contagious. This is an adequate model for large-scale disease propagation, where each disease has a different contagious period and infection rate. This basic model is less accurate when applied to small communities, where the differences between individuals cannot be statistically ignored, or when applied to the spread of information rather than disease.
Extensions
Two research papers by Santa Fe Institute researchers extend the infection model to better reflect human behavior and repurpose it to examine the spread of ideas. Duncan Watts’ “A Simple Model of Global Cascades on Random Networks” proposes that each individual has a different susceptibility to infection, which they call an “Activation Threshold”, represented as a percentage of a node’s peers that must be infected before the node will be infected.
To understand this idea, consider a social platform like Twitter or Google+ in its infancy. Some people are early adopters - as soon as they hear a friend is on the platform they will join the platform to participate. Other people are more apprehensive, but once a majority of their peers have Facebook accounts then they, too, will make Facebook accounts so they do not miss out on significant social community. Early adopters have a low activation threshold, apprehensive people have a high threshold.
The result is that a cascade can only succeed in overwhelming a community if it reaches a “critical mass” where adoption is high enough to pass every member’s activation threshold:
If the activation threshold is too high, or the cascade starts in a poor location where many peers have high thresholds, then the cascade will be unable to reach a critical mass, then the infection will fizzle out. This may explain why some ideas, like Twitter or Facebook, succeed, while others like Google+ or Voat, do not. A failed cascade can convert a small cluster of users, but is ultimately contained by high threshold peers:
Akbarpour and Jackson propose a radically different, if simple, extension in “Diffusion in Networks and the Virtue of Burstiness”. They argue that it is insufficient for two people to have a social link for an idea to spread - the users must meet in the same place at the same time. People fall in one of three patterns:
-
Active for long periods, inactive for long periods. Think of office workers that are only at work from 9 to 5. If two offices are geographically separated, they can only share information while their work days overlap.
-
Active then inactive in quick succession. Perhaps someone that takes frequent breaks from work to have side conversations with their neighbors.
-
Random activity patterns. Likely better for representing online communities where someone can check in from their phone at any time.
My Work
While random networks are simple, human communities are rarely random. Since their introduction in 1999, human communities have more frequently been modeled as scale-free networks. In a scale-free network, new members of the community prefer to connect to well-connected or “popular” members. This results in a small number of highly connected, very social individuals referred to as “hubs”, each with many peers with far fewer connections. Here is an example scale-free network demonstrating the hub-clustering phenomenon:
My objective is to combine the above two papers, and apply the results to scale-free networks. In this configuration, the activity pattern and activation threshold of the hubs is of paramount importance, since the hubs act as gatekeepers between different sections of the network.
When a hub is infected, the cascade will spread rapidly. The hub is connected to a large number of peers, and makes up a significant percentage of the neighbors for each of those peers, since most nodes in the network only have a handful of connections. This means an infected hub can overcome even a relatively high activation threshold.
Compromising even a single hub will allow the cascade to reach new branches of the network and dramatically furthers infection:
However, infecting a hub is challenging, because hubs have so many peers that even a low activation threshold can prove to be an obstacle. Without capturing a hub, the spread of a cascade is severely hindered:
Even with highly susceptible peers, well-protected hubs can isolate a cascade to a district with ease:
Next Steps
So far, I have implemented Watts’ idea of “activation thresholds” on scale-free networks, and have implemented-but-not-thoroughly-explored the activity models from the Burstiness paper. The next step is to examine the interplay between activity types and activation thresholds.
These preliminary results suggest that highly centralized, regimented networks are better able to suppress cascades, but when a cascade does spread, it will be rapid, dramatic, and destabilizing. A fully decentralized, random network has far more frequent and chaotic cascades. Is there a mid-level topology, where small cascades are allowed to occur frequently, but the thread of a catastrophic cascade is minimized? I would like to investigate this further.
Patching Registration Checks, An Introduction
Posted 7/31/18
Taking a break from recent social architecture posts, here’s some more technical security content. It’s a pretty soft introduction to reverse engineering and binary patching for those unfamiliar with the topic.
Prelude
One of the tools I use in my social research recently became abandonware. The product requires annual registration, but earlier this year the developer’s website disappeared, no one has been able to reach them by email for months, and I literally cannot give them my money to reactivate the product. Unfortunately, I am still reliant on the tool for my work. With no alternative, let’s see if the software can be reactivated through more technical means.
Analysis
The tool in question is a graph layout plugin for Cytoscape, so it’s distributed as a JAR file. JAR files are bundled executables in Java - they’re literally ZIP archives with a few specific files inside.
The goal is to find where the software checks whether it’s registered, and patch the binary so it always returns true.
Since this is Java, we’ll start with a decompiler. The goal of a decompiler is to go from compiled bytecode back to human-readable sourcecode in a language like Java or C. On platforms like x86 this is often very messy and unreliable, both because x86 is disgustingly complicated, and because there are many valid C programs that could compile to the same assembly. Fortunately, today we’re working with JVM bytecode, which is relatively clean and well-understood, so the JVM to Java decompilers are surprisingly capable.
I’ll be using JD-Gui, the “Java Decompiler”. Sounds like the tool for the job. Open up JD-GUI, tell it to open the JAR file, and we’re presented with a screen like this:
Wandering through the .class files in com (where most of the code resides), we eventually find reference to public static boolean isActivated(), which sure sounds promising. Here’s the method definition:
If either the product is activated, or it’s still in a trial period, the function returns true. This appears to be our golden ticket. Let’s change this method so that it always returns true.
Patching
There are two techniques for patching Java code. The apparently simple option would be to use a decompiler to get Java code out of this JAR, change the Java code, then recompile it back in to a JAR. However, this assumes the decompiler was 100% perfectly accurate, and the JAR you get at the end is going to look rather different than the one you started with. Think throwing a sentence in to Google Translate and going from English to Japanese back to English again.
The cleaner technique is to leave the JAR intact, and patch this one method while it is still JVM bytecode. The decompiler helped find the target, but we’ll patch at the assembly level.
First, we’ll need to extract contents of the JAR. Most JVM bytecode editors work at the level of .class files, and won’t auto-extract and repack the JAR for us.
$ mkdir foo
$ cp foo.jar foo
$ cd foo
$ jar -xf foo.jar
Now all the individual files visible in the JD-Gui sidebar are unpacked on the filesystem to edit at our leisure. Let’s grab the Java Bytecode Editor, open the DualLicenseManager.class file, and scroll to the isActivated() method:
Above is the assembly for the short Java if-statement we saw in JD-GUI. If isProductActivated() returns true, jump to line 14 and push a 1 on the stack before jumping to line 19. Else, if isTrialActivated() returns false, jump to line 18 and push a 0 on the stack. Then, return the top item on the stack.
Uglier than the Java, but not hard to follow. The patch is trivially simple - change the iconst_0 to an iconst_1, so that no matter what, the method always pushes and returns a 1.
Then we save the method, and it’s time to re-pack the JAR.
Re-Packaging
Re-creating the JAR is only slightly more complicated than unpacking:
$ jar -cvf foo.jar *
$ jar -uvfm foo.jar META-INF/MANIFEST.MF
For some reason creating a JAR from the contents of a folder ignores the manifest and creates a new one. Since we specifically want to include the contents of the manifest file (which include some metadata necessary for the plugin to connect with Cytoscape), we explicitly update the manifest of the JAR with the manifest.mf file.
Conclusion
From here, we can reinstall the plugin in Cytoscape and it runs like a charm.
Often, this kind of binary patching is less straightforward. This work would have been much more time-consuming (though not much more challenging) if the executable had not included symbols, meaning none of the method names are known. Most C and C++ executables do not include symbols, so you are forced to learn what each function does by reading the assembly or looking at the context in which the function is called. This is done for performance more than security, since including symbols makes the executable larger, and is only helpful for the developers during debugging.
More security-minded engineers will use tools like Packers to obfuscate how the code works and make it more difficult to find the relevant method. These are not insurmountable, but usually require watching the packer decompress the main program in memory, waiting for the perfect moment, then plucking it from memory to create an unpacked executable.
Another option is including some kind of checksumming so that the program can detect that it has been tampered with, and refuses to run, or modifies its behavior. This is rarely helpful however, since the reverse engineer can simply look for the appropriate hasBeenTamperedWith() function and patch it to always return false. An insidious programmer could try to hide this kind of code, but it’s a cat-and-mouse game with the reverse engineer that will only buy them time.
Ultimately, this tool was built by scientists, not battle-hardened security engineers, and included no such counter-measures. Should they resurface I will gladly continue paying for their very useful software.
Democratic Censorship
Posted 4/22/18
There’s been a lot of discourse recently about the responsibility social media giants like Facebook and Twitter have to police their communities. Facebook incites violence by allowing false-rumors to circulate. Twitter only recently banned large communities of neo-nazis and white supremacists organizing on the site. Discord continues to be an organizational hub for Nazis and the Alt-Right. There’s been plenty of discussion about why these platforms have so little moderatorship, ranging from their business model (incendiary content drives views and is beneficial for Facebook), to a lack of resources, to a lack of incentive.
I’d like to explore a new side of the issue: Why should a private company have the role of a cultural censor, and how can we redesign our social media to democratize censorship?
To be absolutely clear, censorship serves an important role in social media in stopping verbal and emotional abuse, stalking, toxic content, and hate speech. It can also harm at-risk communities when applied too broadly, as seen in recent well-intentioned U.S. legislation endangering sex workers.
On Freedom of Speech
Censorship within the context of social media is not incompatible with free-speech. First, Freedom of Speech in the United States is largely regarded to apply to government criticism, political speech, and advocacy of unpopular ideas. These do not traditionally include speech inciting immediate violence, obscenity, or inherently illegal content like child pornography. Since stalking, abuse, and hate-speech do not contribute to a public social or political discourse, they fall squarely outside the domain of the USA’s first amendment.
Second, it’s important to note that censorship in social media means a post is deleted or an account is locked. Being banned from a platform is more akin to exile than to arrest, and leaves the opportunity to form a new community accepting of whatever content was banned.
Finally there’s the argument that freedom of speech applies only to the government and public spaces, and is inapplicable to a privately-owned online space like Twitter or Facebook. I think had the U.S. Bill of Rights been written after the genesis of the Internet this would be a non-issue, and we would have a definition for a public commons online. Regardless, I want to talk about what should be, rather than what is legally excusable.
The Trouble with Corporate Censors
Corporations have public perceptions which effect their valuations. Therefore, any censorship by the company beyond what is legally required will be predominantly focused on protecting the ‘image’ of the company and avoiding controversy so they are not branded as a safe-haven for bigots, nazis, or criminals.
Consider Apple’s censorship of the iOS App Store - repeatedly banning drone-strike maps with minimal explanatory feedback. I don’t think Apple made the wrong decision here; they reasonably didn’t want to be at the epicenter of a patriotism/pro-military/anti-war-movement debate, since it has nothing to do with their corporation or public values. However, I do think that it’s unacceptable that Apple is in the position of having this censorship choice to begin with. A private corporation, once they have sold me a phone, should not have say over what I can and cannot use that phone to do. Cue Free Software Foundation and Electronic Frontier Foundation essays on the rights of the user.
The same argument applies to social media. Facebook and Twitter have a vested interest in limiting conversations that reflect poorly on them, but do not otherwise need to engender a healthy community dynamic.
Sites like Reddit that are community-moderated have an advantage here: Their communities are self-policing, both via the main userbase downvoting inappropriate messages until they are hidden, and via appointed moderators directly removing unacceptable posts. This works well in large subreddits, but since moderators have authority only within their own sub-communities there are still entire subreddits accepting of or dedicated to unacceptable content, and there are no moderators to review private messages or ban users site wide. A scalable solution will require stronger public powers.
Federated Communities
The privacy, anonymity, and counter-cultural communities have been advocating “federated” services like Mastadon as an alternative to centralized systems like Twitter and Facebook. The premise is simple: Anyone can run their own miniature social network, and the networks can be linked at will to create a larger community.
Privacy Researcher Sarah Jamie Lewis has written about the limitations of federated models before, but it boils down to “You aren’t creating a decentralized democratic system, you’re creating several linked centralized systems, and concentrating power in the hands of a few.” With regards to censorship this means moving from corporate censors to a handful of individual censors. Perhaps an improvement, but not a great one. While in theory users could react to censorship by creating a new Mastadon instance and flocking to it, in reality users are concentrated around a handful of large servers where the community is most vibrant.
Components of a Solution
A truly self-regulatory social community should place control over censorship of content in the hands of the public, exclusively. When this leads to a Tyranny of the Majority (as I have no doubt it would), then the effected minorities have an incentive to build a new instance of the social network where they can speak openly. This is not an ideal solution, but is at least a significant improvement over current power dynamics.
Community censorship may take the form of voting, as in Reddit’s “Upvotes” and “Downvotes”. It may involve a majority-consensus to expel a user from the community. It may look like a more sophisticated republic, where representatives are elected to create a temporary “censorship board” that removes toxic users after quick deliberation. The key is to involve the participants of the community in every stage of decision making, so that they shape their own community standards instead of having them delivered by a corporate benefactor.
Care needs to be taken to prevent bots from distorting these systems of governance, and giving a handful of users de-facto censorship authority. Fortunately, this is a technical problem that’s been explored for a long time, and can be stifled by deploying anti-bot measures like CAPTCHAs, or by instituting some system like “voting for representatives on a blockchain”, where creating an army of bot-votes would become prohibitively expensive.
This should be not only compatible, but desirable, for social media companies. Allowing the community to self-rule shifts the responsibility for content control away from the platform provider, and means they no longer need to hire enormous translator and moderator teams to maintain community standards.
Hacker Community Espionage
Posted 1/7/18
I recently got to see a talk at the Chaos Communication Congress titled “When the Dutch secret service knocks on your door”, with the following description:
This is a story of when the Dutch secret service knocked on my door just after OHM2013, what some of the events that lead up to this, our guesses on why they did this and how to create an environment where we can talk about these things instead of keeping silent.
Since the talk was not recorded, the following is my synopsis and thoughts. This post was written about a week after the talk, so some facts may be distorted by poor memory recall.
-
The speaker was approached by members of the Dutch secret service at his parents’ house. They initially identified themselves as members of the department of the interior, but when asked whether they were part of the secret service, they capitulated.
-
The agents began by offering all-expenses-paid travel to any hackathon or hackerspace. All the speaker needed to do was write a report about their experience and send it back. A relatively harmless act, but it means they would be an unannounced informant in hacker communities.
-
When the author refused, the agents switched to harder recruitment techniques. They pursued the author at the gym, sat nearby in cafes when the author held meetings for nonprofits, and likely deployed an IMSI catcher to track them at a conference.
-
Eventually, the author got in contact with other members of the hacker community that had also been approached. Some of them went further through the recruitment process. The offers grew, including “attend our secret hacker summer camp, we’ll let you play with toys you’ve never heard of,” and “If you want to hack anything we can make sure the police never find out.” In either of these cases the recruit is further indebted to the secret service, either by signing NDAs or similar legal commitments to protect government secrets, or by direct threat, wherein the government can restore the recruit’s disappeared criminal charges at any time.
I have two chief concerns about this. First, given how blatant the secret service was in their recruitment attempts, and that we only heard about their attempts in December of 2017, we can safely assume many people accepted the government’s offer. Therefore, there are likely many informants working for the secret service already.
Second, this talk was about the Netherlands - a relatively small country not known for their excessive surveillance regimes like the Five Eyes. If the Netherlands has a large group of informants spying on hackerspaces and conferences around the globe, then many other countries will as well, not to mention more extreme measures likely taken by countries with more resources.
From this, we can conclude there are likely informants in every talk at significant conferences. Every hackerspace with more than token attendance is monitored. This is not unprecedented - the FBI had a vast array of informants during the COINTELPRO era that infiltrated leftist movements throughout the United States (along with much less savory groups like the KKK), and since shortly after 9/11 has used a large group of Muslim informants to search for would-be terrorists.
Alcoholics Anonymous as Decentralized Architecture
Posted 1/6/18
Most examples of decentralized organization are contemporary: Black Lives Matter, Antifa, the Alt-Right, and other movements developed largely on social media. Older examples of social decentralization tend to be failures: Collapsed Hippie communes of the 60s, anarchist and communist movements that quickly collapsed or devolved to authoritarianism, the “self-balancing free market,” and so on.
But not all leaderless movements are short-lived failures. One excellent example is Alcoholics Anonymous: An 82-year-old mutual aid institution dedicated to helping alcoholics stay sober. Aside from their age, AA is a good subject for study because they’ve engaged in a great deal of self-analysis, and have very explicitly documented their organizational practices.
Let’s examine AA’s Twelve Traditions and see what can be generalized to other organizations. The twelve traditions are reproduced below:
-
Our common welfare should come first; personal recovery depends on AA unity.
-
For our group purpose there is but one ultimate authority - a loving God as He may express Himself in our group conscience.
-
The only requirement for AA membership is a desire to stop drinking.
-
Each group should be autonomous except in matters affecting other groups or AA as a whole.
-
Each group has but one primary purpose - to carry its message to the alcoholic who still suffers.
-
An AA group ought never endorse, finance or lend the AA name to any related facility or outside enterprise, lest problems of money, property and prestige divert us from our primary purpose.
-
Every AA group ought to be fully self-supporting, declining outside contributions.
-
Alcoholics Anonymous should remain forever nonprofessional, but our service centers may employ special workers.
-
AA, as such, ought never be organized; but we may create service boards or committees directly responsible to those they serve
-
Alcoholics Anonymous has no opinion on outside issues; hence the AA name ought never be drawn into public controversy.
-
Our public relations policy is based on attraction rather than promotion; we need always maintain personal anonymity at the level of press, radio and films.
-
Anonymity is the spritual foundation of all our traditions, ever reminding us to place principles before personalitites.
The above twelve rules can be distilled to three themes:
-
The group comes first
-
The group is single-issue
-
The group should be independent of any external or internal structures
The first theme stresses anonymity in an interesting way: Not to protect individual members (many of whom want to be anonymous when in an organization like AA), but to prevent the rise of “rock-stars”, or powerful individuals with celebrity status. Personal power is prone to abuse, both at an inter-personal level (see the plethora of sexual abuse cases in the news right now), and at a structural level, where the organization becomes dependent on this single individual, and is drawn in to any conflict surrounding the celebrity.
The solution to a rock-star is to kick them out of the organization, and maintain a healthier community without them. AA has gone a step further however, and outlines how to prevent the rise of a rock-star by preventing any personal identification when communicating to the outside world. When you are speaking to the press you are Alcoholics Anonymous, and may not use your name. For further discussion on rock-stars in tech communities, see this article.
The single-issue design is an unusual choice. Many social movements like the Black Panthers stress solidarity, the idea that we should unite many movements to increase participants and pool resources. This is the same principle behind a general strike, and broad, cross-issue activist networks like the Indivisible movement. However, focusing on a single issue continues the trend of resisting corruption and abuse of power. AA keeps a very strict, simple mission, with no deviations.
The last theme, total organizational independence, is also unusual. Organizations that fear external attack, like terrorist cells, may operate in isolation from other cells with little to no higher-level coordination. Organizations avoiding internal corruption, like the Occupy movement, or fraternities, may limit internal leadership and centralization of power using systems like Robert’s Rules of Order or Clusters & Spokes Councils, or they may organize more anarchically, through organic discussion on social media. Avoiding both internal and external hierarchy, however, sacrifices both large-scale coordination and quick decision making. This works for Alcoholics Anonymous, because their mission is predefined and doesn’t require a great deal of complex leadership and decision making. It is also used by Antifa, where local groups have no contact with one another and rely on collective sentiment to decide on actions.
Overall, AA is an interesting introduction to decentralized organizations. I will revisit these ideas as I learn more.
Halftone QR Codes
Posted 12/19/17
I recently encountered a very neat encoding technique for embedding images into Quick Response Codes, like so:

A full research paper on the topic can be found here, but the core of the algorithm is actually very simple:
-
Generate the QR code with the data you want
-
Dither the image you want to embed, creating a black and white approximation at the appropriate size
-
Triple the size of the QR code, such that each QR block is now represented by a grid of 9 pixels
-
Set the 9 pixels to values from the dithered image
-
Set the middle of the 9 pixels to whatever the color of the QR block was supposed to be
-
Redraw the required control blocks on top in full detail, to make sure scanners identify the presence of the code
That’s it! Setting the middle pixel of each cluster of 9 generally lets QR readers get the correct value for the block, and gives you 8 pixels to represent an image with. Occasionally a block will be misread, but the QR standard includes lots of redundant checksumming blocks to repair damage automatically, so the correct data will almost always be recoverable.
There is a reference implementation in JavaScript of the algorithm I’ve described. I have extended that code so that when a pixel on the original image is transparent the corresponding pixel of the final image is filled in with QR block data instead of dither data. The result is that the original QR code “bleeds in” to any space unused by the image, so you get this:

Instead of this:

This both makes the code scan more reliably and makes it more visually apparent to a casual observer that they are looking at a QR code.
The original researchers take this approach several steps further, and repeatedly perturb the dithered image to get a result that both looks better and scans more reliably. They also create an “importance matrix” to help determine which features of the image are most critical and should be prioritized in the QR rendering. Their code can be found here, but be warned that it’s a mess of C++ with Boost written for Microsoft’s Visual Studio on Windows, and I haven’t gotten it running. While their enhancements yield a marked improvement in image quality, I wish to forgo the tremendous complexity increase necessarily to implement them.
Cooperative Censorship
Posted 8/19/17
I have long been an opponent of censorship by any authority. Suppression of ideas stifles discussion, and supports corruption, authoritarianism, and antiquated, bigoted ideas. I have put a lot of thought in to distributed systems, like Tor or FreeNet, that circumvent censorship, or make it possible to host content that cannot be censored.
However, the recent Charlottesville protests show another side of the issue. Giving the alt-right a prolific voice online and in our media has allowed the Nazi ideology to flourish. This isn’t about spreading well-reasoned ideas or holding educational discussion - the goal of white supremacists is to share a message of racial superiority and discrimination based wholly in old hateful prejudice, not science or intellectual debate.
The progress of different hosting providers shutting down the Daily Stormer neo-Nazi community site shows how hesitant Corporate America is to censor - whether out of concern for bad PR, loss of revenue, perception of being responsible for the content they facilitate distribution of, or (less likely) an ideological opposition to censorship.
Ultimately, I still belief in the superiority of decentralized systems. Money-driven corporations like GoDaddy and Cloudflare should not be in the position where they are cultural gatekeepers that decide what content is acceptable and what is not. At the same time, a distributed system that prevents censorship entirely may provide an unreasonably accessible platform for hate speech. No censorship is preferable to authoritarian censorship, but is there a way to build distributed community censorship, where widespread rejection of content like white supremacy can stop its spread, without allowing easy abuse of power? If it is not designed carefully such a system would be prone to Tyranny of the Majority, where any minority groups or interests can be oppressed by the majority. Worse yet, a poorly designed system may allow a large number of bots to “sway the majority”, effectively returning to an oligarchic “tyranny of the minority with power” model. But before ruling the concept out, let’s explore the possibility some…
Existing “Distributed Censorship” Models
Decentralized Twitter clone Mastadon takes a multiple-instances approach to censorship. Effectively, each Mastadon server is linked together, or “federated”, but can refuse to federate with particular servers if the server admin chooses to. Each server then has its own content guidelines - maybe one server allows pornography, while another server forbids pornography and will not distribute posts from servers that do. This allows for evasion of censorship and the creation of communities around any subject, but content from those communities will not spread far without support from other servers.
Facebook lookalike Diaspora has a similar design, distributing across many independently operated servers called “pods”. However, content distribution is primarily decided by the user, not the pod administrator. While the pod administrator chooses what other pods to link to, the user independently chooses which users in those pods their posts will be sent to, with a feature called “aspects”. This ideally lets a user segment their friend groups from family or work colleagues, all within the same account, although there is nothing preventing users from registering separate accounts to achieve the same goal.
Both of these models distribute censorship power to server administrators, similar to forum or subreddit moderators. This is a step in the right direction from corporate control, but still creates power inequality between the relatively few server operators and the multitude of users. In the Mastadon example, the Mastadon Monitoring Project estimates that there are about 2400 servers, and 1.5 million registered users. That is, about 0.16% of the population have censorship control. While there’s nothing technical stopping a user from starting their own server and joining the 0.16%, it does require a higher expertise level, a server to run the software on, and a higher time commitment. This necessarily precludes most users from participating in censorship (and if we had 1.5 million Mastadon servers then administering censorship would be unwieldy).
Other Researcher’s Thoughts
The Digital Currency Initiative and the Center for Civic Media (both MIT groups) released a relevant report recently on decentralized web technologies, their benefits regarding censorship, and adoption problems the technologies face. While the report does not address the desirability of censoring hate speech, it does bring up the interesting point that content selection algorithms (like the code that decides what to show on your Twitter or Facebook news feeds) are as important to censorship as actual control of what posts are blocked. This presents something further to think about - is there a way to place more of the selection algorithm under user control without loading them down with technical complexity? This would allow for automatic but democratic censorship, that may alleviate the disproportionate power structures described above.
Braess’s Paradox
Posted 8/8/17
I had the great fortune of seeing a talk by Brian Hayes on Braess’s Paradox, an interesting network congestion phenomenon. In this post I’ll talk about the problem, and some ramifications for other fields.
The Problem
Consider a network of four roads. Two roads are extremely wide, and are effectively uncongested, regardless of how many cars are present. They still have speed limits, so we’ll say there’s a constant traversal time of “one hour” for these roads. The other two roads, while more direct and thereby faster, have only a few lanes, and are extremely prone to congestion. As an estimate, we’ll say the speed it takes to traverse these roads scales linearly with “N”, the number of cars on the road, such that if all the cars are one one road it will take one hour to travel on.
If a driver wants to get from point A to point B, what route is fastest? Clearly, by symmetry, the two paths are the same length. Therefore, the driver should take whatever path is less-congested, or select randomly if congestion is equal. Since half the cars will be on each path, the total commute time is about 1.5 hours for all drivers.
However, consider the following change:
In this network we’ve added a new path that’s extremely fast (no speed limits, because they believe in freedom), to the point that we’ll consider it instantaneous.
What is the optimal path for a driver now? A lone driver will obviously take the first direct road, then the shortcut, then the second direct road. However, if all “N” drivers take this route the small roads will be overloaded, increasing their travel time to one hour each. The total commute for each driver will now be two hours.
Consider that you are about to start driving, and the roads are overloaded. If you take the short route your commute will be two hours long. However, if you take the long route your commute will be two hours long, and the other roads will be less overloaded (since without you only N-1 cars are taking the route), so everyone else will have a commute slightly shorter than two hours. This means from a greedy algorithm perspective there is always an incentive to take the more direct route, and help perpetuate the traffic problem.
Simply put, adding a shortcut to the network made performance worse, not better.
The Solution
There are a number of potential solutions to the problem. Law enforcement might demand that drivers select their routes randomly, saving everyone half an hour of commute. Similarly, self-driving cars may enforce random path selection, improving performance without draconian-feeling laws. These are both “greater good” solutions, which assume drivers’ willingness to sacrifice their own best interests for the interests of the group. Either of these solutions provide an incentive for drivers to cheat - after all, the shortcut is faster so long as there are only a few people using it.
Another option is limiting information access. The entire problem hinges on the assumption that users know the to-the-moment traffic information for each possible route, and plan their travel accordingly. Restricting user information to only warn about extreme congestion or traffic accidents effectively prohibits gaming the system, and forces random path selection.
Generalization
Braess’s Paradox is an interesting problem where providing more limited information improves performance for all users. Are there parallels in other software problems? Any system where all nodes are controlled by the same entity can be configured for the “greater good” solution, but what about distributed models like torrenting, where nodes are controlled by many people?
In a torrenting system, users have an incentive to “cheat” by downloading chunks of files without doing their share and uploading in return. Consider changing the system so users do not know who has the chunks they need, and must made trades with various other nodes to acquire chunks, discovering after the fact whether it was what they were looking for. Users now must participate in order to acquire the data they want. This may slow the acquisition of data, since you can no longer request specific chunks, but it may also improve the total performance of the system, since there will be far more seeders uploading data fragments.
The performance detriment could even be alleviated by allowing the user to request X different chunks in their trade, and the other end must return the appropriate chunks if they have them. This limits wasteful exchanges, while still ensuring there are no leechers.
Fun thought experiment that I expect has many more applications.
Merkle’s Puzzle-box Key Exchange
Posted 7/17/17
Cryptography is fantastic, but much of it suffers from being unintuitive and math-heavy. This can make it challenging to teach to those without a math or computer science background, but makes it particularly difficult to develop a sense of why something is secure.
There are a handful of cryptographic systems however, that are delightfully easy to illustrate and provide a great introduction to security concepts. One such system is Merkle’s Puzzles.
The Problem
Similar to the Diffie-Hellman Key Exchange, the goal of Merkle’s Puzzle Boxes is for two parties (we’ll call them Alice and Bob) to agree on a password to encrypt their messages with. The problem is that Alice and Bob can only communicate in a public channel where anyone could be listening in on them. How can they exchange a password securely?
The Process
Alice creates several puzzle boxes (since she has a computer, we’ll say she makes several thousand of them). Each puzzle box has three pieces:
- A random number identifying the box
- A long, random, secure password
- A hash of parts 1 and 2
Each “box” is then encrypted with a weak password that can be brute-forced without taking too long. Let’s say it’s a five character password.
Alice then sends all her encrypted puzzle boxes to Bob:
Bob selects one box at random, and brute-forces the five character password. He knows he has the right password because the hash inside the box will match the hash of parts 1 and 2 in the box. He then announces back to Alice the number of the box he broke open.
Alice (who has all the unlocked puzzle boxes already) looks up which box Bob has chosen, and they both begin encrypting their messages with the associated password.
Why is it Secure?
If we have an eavesdropper, Eve, listening in to the exchange, then she can capture all the puzzle boxes. She can also hear the number of the puzzle box Bob has broken in to when he announces it back to Alice. Eve doesn’t know, however, which box has that number. The only way to find out is to break in to every puzzle box until she finds the right one.
This means while it is an O(1) operation for Bob to choose a password (he only has to break one box), it is an O(n) operation for Eve to find the right box by smashing all of them.
This also means if we double the number of puzzle-boxes then the exchange has doubled in security, because Eve must break (on average) twice as many boxes to find what she’s looking for.
Why don’t we use Puzzle-boxes online?
Merkle’s puzzles are a great way of explaining a key exchange, but computationally they have a number of drawbacks. First, making the system more secure puts a heavy workload on Alice. But more importantly, it assumes the attackers and defenders have roughly the same computational power.
An O(n) attack complexity means Eve only needs n times more CPU time than Bob to crack the password - so if the key exchange is configured to take three seconds, and there are a million puzzle boxes, then it would take 35 days for that same computer to crack. But if the attacker has a computer 100 times faster than Bob (say they have a big GPU cracking cluster) then it will only take them 0.35 days to break the password. A more capable attacker like a nation state could crack such a system almost instantly.
If Eve is recording the encrypted conversation then she can decrypt everything after the fact once she breaks the puzzle box challenge. This means even the original 35-day attack is viable, let alone the GPU-cluster attack. As a result, we use much more secure algorithms like Diffie-Hellman instead.
Port Knocking
Posted 7/17/17
Port knocking is a somewhat obscure technique for hiding network services. Under normal circumstances an attacker can use a port scanner to uncover what daemons are listening on a server:
$ nmap -sV backdrifting.net
Starting Nmap 6.46 ( http://nmap.org ) at 2017-07-17
Nmap scan report for backdrifting.net (XX.XXX.XX.XX)
Host is up (0.075s latency).
Not shown: 990 filtered ports
PORT     STATE  SERVICE    VERSION
22/tcp   open   ssh        (protocol 2.0)
80/tcp   open   http       Apache httpd
443/tcp  open   ssl/http   Apache httpd
465/tcp  closed smtps
587/tcp  open   smtp       Symantec Enterprise Security manager smtpd
993/tcp  open   ssl/imap   Dovecot imapd
Note: Port scanning is illegal in some countries - consult local law before scanning others.
Sometimes however, a sysadmin may not want their services so openly displayed. You can’t brute-force ssh logins if you don’t know sshd is running.
The Technique
With port knocking, a daemon on the server secretly listens for network packets. A prospective client must make connections to a series of ports, in order, without interruption and in quick succession. Note that these ports do not need to be open on the server - attempting to connect to a closed port is enough. Once this sequence is entered, the server will allow access to the hidden service for the IP address in question.
This sounds mischievously similar to steganography - we’re hiding an authentication protocol inside failed TCP connections! With that thought driving me, it sounded like writing a port-knocking daemon would be fun.
Potential Designs
There are several approaches to writing a port-knocker. One is to run as a daemon listening on several ports. This is arguably the simplest approach, and doesn’t require root credentials, but is particularly weak because a port scanner will identify the magic ports as open, leaving the attacker to discover the knocking combination.
Another approach (used by Moxie Marlinspike’s knockknock) is to listen to kernel logs for rejected incoming TCP connections. This approach has the advantage of not requiring network access at all, but requires that the kernel output such information to a log file, making it less portable.
The third (and most common) approach to port knocking is to use packet-sniffing to watch for incoming connections. This has the added advantage of working on any operating system libpcap (or a similar packet sniffing library) has been ported to. Unfortunately it also requires inspecting each packet passing the computer, and usually requires root access.
Since I have some familiarity with packet manipulation in Python already, I opted for the last approach.
The Implementation
With Scapy, the core of the problem is trivial:
def process_packet(packet):
        src = packet[1].src     # IP Header
        port = packet[2].dport  # TCP Header
        if( port in sequence ):
                knock_finished = addKnock(sequence, src, port, clients)
                if( knock_finished ):
                        trigger(username, command, src)
        # Sequence broken
        elif( src in clients ):
                del clients[src]

sniff(filter="tcp", prn=process_packet)
The rest is some semantics about when to remove clients from the list, and dropping from root permissions before running whatever command was triggered by the port knock. Code available here.
Decentralized Networks
Posted 7/9/17
A solution to the acyclic graph problem has been found! This post adds to the continuing thread on modeling social organizations with Neural Networks (post 1) (post 2) (post 3)
The Dependency Problem
The issue with cyclic neural networks is dependencies. If we say Agent A factors in information from Agent B when deciding what message to transmit, but Agent B factors in messages from Agent A to make its decision, then we end up with an infinite loop of dependencies. One solution is to kickstart the system with a “dummy value” for Agent B (something like “On iteration 1, Agent B always transmits 0”), but this is clunky, difficult to perform in a library like Tensorflow, and still doesn’t mesh well with arbitrary evaluation order (for each iteration, do you evaluate A or B first?).
Instead, we can bypass the problem with a one-directional loop. The trick is as follows:
- Agent A0 sends a message (not dependent on B)
- Agent B0 receives A0’s message, and decides on a message to send
- Agent A1 receives B0’s message, and factors it (along with the messages A0 received) in to deciding on a message to send
- Agent B1 receives A1’s message, and factors it (along with the messages B0 received) in to deciding on a message to send
We have now created a dependency tree where A can rely on B’s message, and B can rely on the message generated in response, but all without creating an infinite loop. When judging the success of such a network, we look only at the outputs of A1 and B1, not their intermediate steps (A0 and B0).
If it’s absolutely essential you can create a third layer, where A2 is dependent on the message sent by B1, and so on. As you approach an infinite number of layers you get closer and closer to the original circular dependency solution, but using more than two or three layers usually slows down computation considerably without yielding significantly different results.
Social-Orgs, Revisited
With the above solution in mind, let’s re-evaluate the previous social-group problems with two layers of Agents instead of one. Each layer can send all of the data it’s received, with no communications cost or noise, to its counterpart one layer up. This effectively creates the A0 and A1 dynamic described above. When evaluating the success of the network we will look at the accuracy of environmental estimates from only the outermost layer, but will count communications costs from all layers.
Tada! A social organization that doesn’t revolve around A0 reading every piece of the environment itself!
Note: In the above graph, most nodes only have a 0 or 1 layer, not both. This is because the other layer of the agent does not listen to anything, and is not shown in the graph. More complex examples will include both layers more frequently.
The result is still unlikely - all information passes through A2 before reaching the agents (even A0 gets information about three environment nodes through A2) - but it’s already more balanced than previous graphs.
Next Steps
A better evaluation algorithm is needed. With the two-layer solution there is no longer a requirement for centralization - but there is no incentive for decentralization, either. A real human organization has not only total costs, but individual costs as well. Making one person do 100 units of work is not equivalent to making 10 people do 10 units of work. Therefore, we need a cost algorithm where communications become exponentially more expensive as they are added to a worker. This should make it “cheaper” to distribute labor across several workers.
Attribution
This post is based off of research I am working on at the Santa Fe Institute led by David Wolpert and Justin Grana. Future posts on this subject are related to the same research, even if they do not explicitly contain this attribution.
Ruggedized Networks
Posted 7/6/17
This post adds to my posts on modeling social organizations with Neural Networks (post 1) (post 2)
The Problem
The original model defined the objective as minimizing communications costs while getting an estimate of the environment state, and sharing that estimate with all nodes. This objective has a flaw, in that it is always cheaper to let a single agent read an environment node, making that agent a single point of failure. This flaw is exacerbated by the Directed Acyclic Graph limitation, which means since A0 must always read from the environment, it is always cheapest to have the entire network rely on A0 for information.
An Attack
I recently worked on developing a welfare function emphasizing robustness, or in this case, the ability of the network to complete its objective when a random agent is suddenly removed. The result should be a network without any single points of failure, although I am not accounting for multi-agent failures.
The result is as follows:
In this diagram, all agents receive information from A0. However, most of them also receive information from A2, which receives information from A1, which is monitoring the entire environment. As a result, when A0 is disabled, only nodes A3 and A5 are negatively effected.
How it Works
To force robustness I created eleven parallel versions of the graph. They have identical listen weights (the amount any agent tries to listen to any other agent), and begin with identical state weights (how information from a particular agent is factored in to the estimate of the environment), and identical output weights (how different inputs are factored in to the message that is sent).
The difference is that in each of these parallel graphs (except the first one) a single Agent is disabled, by setting all of its output weights to zero. The welfare of the solution is the average of the welfare for each graph.
But why are the state weights and output weights allowed to diverge? Aren’t we measuring ten completely different graphs then?
Not quite. The topology of the network is defined by its listen weights, so we will end up with the same graph layout in each configuration. To understand why the other weights are allowed to diverge, consider an analogy to a corporate scenario:
You are expected to get reports from several employees (Orwell, Alice, and Jim) and combine them to make your own final report. When you hear Jim has been fired, you no longer wait for his report to make your own. Taking input (which isn’t coming) from Jim in to consideration would be foolish.
Similarly, each graph adjusts its state weights and output weights to no longer depend on information from the deleted agent, representing how a real organization would immediately respond to the event.
Then why can’t the listen weights change, too?
This model represents instantaneous reaction to an agent being removed. While over time the example corporation would either replace Jim or restructure around his absence, you cannot instantly redesign the corporate hierarchy and change who is reporting to who. Meetings take time to schedule, emails need to be sent, and so on.
Next Steps
This objective is still limited by the acyclic graph structure, but provides a baseline for valuing resiliency mathematically. Once the acyclic problem is tackled this solution will be revisited.
Attribution
This post is based off of research I am working on at the Santa Fe Institute led by David Wolpert and Justin Grana. Future posts on this subject are related to the same research, even if they do not explicitly contain this attribution.
Cryptocurrency Tutorial
Posted 7/5/17
I was recently asked to give a talk on bitcoin and other related cryptocurrencies. My audience was to be a group of scientists and mathematicians, so people with significant STEM backgrounds, but not expertise in computer science. In preparation for giving my talk, I wrote this breakdown on the ins and outs of cryptocurrencies.
UPDATE 7/11/17
I gave the talk, it went great! Slides here [PDF].
END UPDATE
What is Bitcoin?
Bitcoin is a decentralized currency. There is no governing body controlling minting or circulation, making it appealing to those who do not trust governments or financial institutions like Wall Street.
Where as most currencies have a physical paper representation, bitcoin is exchanged by adding on to a “blockchain”, or a global ledger of who owns what pieces of currency, and what transactions were made when.
Where does the value of Bitcoin come from?
Bitcoin is a fiat currency - Its value comes exclusively from what people are willing to exchange it for. This seems ephemeral, but is not uncommon, and is the same principle behind the value of the US dollar, at least since the United States left the gold standard.
Is Bitcoin anonymous?
Yes and no. All bitcoin transactions are public, and anyone can view the exact amount of money in a bitcoin wallet at any given time. However, bitcoin wallets are not tied to human identities, so as long as you keep the two distinct (which can be challenging), it is effectively “anonymous”.
How is Bitcoin handled legally?
Some countries consider bitcoin to be a currency (with a wildly fluctuating exchange rate), while others regard it as a commodity with an unstable value. Most countries will tax bitcoins in some way or another, but due to the aforementioned anonymity it is easy to avoid paying taxes on bitcoins.
What is the blockchain?
The blockchain is a technology solving two problems:
- How do we know who has what currency?
- How do we prevent someone from spending currency that isn’t theirs?
The second problem includes preventing someone from “double-spending” a bitcoin they legitimately own.
A blockchain is a sequence of “blocks”, where each block holds “facts”. These facts describe every transaction of bitcoins from one person to another. To make a transaction, you must create a block describing the transaction, and convince the majority of the nodes in the bitcoin blockchain to accept your transaction.
What does a block consist of?
A block has four fields:
- A string describing all contained facts
- The identifier of the previous block in the blockchain (maintains an explicit order for all transactions)
- A random string
- The SHA256 hash of all of the above
A block is accepted in to the blockchain if and only if the SHA256 hash starts with at least n leading zeroes. This makes generating a block equivalent to hash cracking (keep changing the random string until you get the hash you want), and the larger n is, the more challenging the problem is to solve.
For example, if n=5:
A losing block hash (will be rejected):
f56d11cb12191d479f89062844ee79c0a899549ec234022d35431d3c6fa5f40d
A winning block hash (will be accepted):
000007e68c86f72084cb7b10b6bb5f12f698ce4ad92acedce2bb95a246e82016
The number of leading zeroes n is increased periodically by group consensus so that even as more people begin to work on generating blocks, the rate of new blocks remains approximately constant (~one every ten minutes). This makes it extremely unlikely that two new and valid blocks will be generated near the same time, and therefore creates a continual chain of events making double-spending impossible.
Looking for a new valid block is colloquially referred to as “bitcoin mining”.
Note: The hashing algorithm (sha256) is specific to bitcoin. Other cryptocurrencies may use different hashing algorithms to discourage the use of GPUs in mining.
Can I spend someone else’s coins by mining a block?
Bitcoins are tied to a “bitcoin wallet”, which is a public/private keypair. To send coins to a new wallet you must make a blockchain fact describing a transfer of X bitcoins from one wallet’s public key to another, signed with the private key of the originating wallet. Therefore unless you have access to the private key, you’ll be unable to control the bitcoins associated with it.
Why would anyone mine blocks?
Each successfully mined block yields the miner some currency. They include their own wallet address as one of the facts in the block, and receive a fixed amount of currency (25BTC for bitcoin) at that address. This is also why you must pay a small transaction fee to send anyone a bitcoin - you are asking someone to include your transaction in their massive mining effort.
Doesn’t this mean there are a fixed number of bitcoins in the world?
Some readers may have noticed that SHA256 has a fixed length (256-bits, or 32 characters). If we periodically increase n, then eventually we will require that all 32 characters of the hash be “0”, which will make adding to the end of the blockchain impossible. Since you receive 25 bitcoins for each mined block, this puts the maximum number of bitcoins at about 21 million.
This upper limit poses a number of problems. There are a finite number of transaction blocks, after which all bitcoins will be unmovable, and therefore worthless. There are a finite number of bitcoins, so if you send some to a non-existent address, or forget your private key, those coins are effectively destroyed forever. This, along with commodity speculation, is responsible for the incredible fluctuation in the value of bitcoin.
Trust Issues
One problem with a decentralized currency like bitcoin is that there is no revocation of money transfers. With a bank, you can make a purchase with a credit card, and later dispute that purchase, claiming you did not receive what you paid for, and the bank can reverse the charge. You can also use banks and lawyers to create contracts, agreeing to pay a certain amount before a service is rendered and a certain amount after, with other complications like security deposits.
None of this infrastructure exists with bitcoin, making it an extremely scam-prone transaction system. Some people use escrow services, but these are all very ad-hoc. This is also one of the reasons bitcoin is commonly used in ransomware attacks, or for purchases of drugs or stolen property on the “deep web”.
What about alt-coins?
There are several variations on bitcoin, called “alternative-coins” or “alt-coins”. Some of the most interesting are:
Namecoin
Namecoin treats the blockchain as an extremely distributed database of information tied to specific identities. It’s effectively the same as bitcoin, except in addition to storing “coins” with particular wallets, you can store domain names, email addresses, public encryption keys, and more.
In theory, this removes the need for centralized DNS servers, or domain-registrars for the Internet. Everyone can perform DNS lookups by looking for the domain name in question in the blockchain, and can transfer domains to each-other in exchange for namecoins.
Ethereum
Ethereum tries to solve the trust issues of bitcoin by allowing you to write programmatically-enforceable contracts and embedding them in to the blockchain.
Consider the following blockchain:

Block A contains a program with psuedocode like the following:
if( security_deposit_received and date == December 5th and house_not_destroyed )
    send(security_deposit, from=Bob, to=Alice)
else if( date > December 5th )
    stop_evaluating
When block A is added to the chain the code inside is evaluated by every node in the chain. The code is re-evaluated as each subsequent block is added, until after December 5th when the code can be safely ignored.
Block B contains a transfer of $1000 from Alice to Bob, as a security deposit.
On December 5th, if the house is not destroyed, the security deposit is automatically returned to Alice by Bob.
Ethereum therefore allows you to create contracts which are enforceable without lawyers or banks, and cannot be violated by either party once issued.
Other uses for Ethereum contracts include provably-fair gambling, and generic distributed computation, where you pay each participating node for running your application.
Ethereum suffers from a few issues:
- The complexity makes it less approachable than Bitcoin
- Without widespread cryptographically verifiable Internet-of-Things devices the types of contracts you can express are limited
- All code is publicly viewable, but not changeable, so if someone finds a security hole in your code, it cannot be easily patched
Despite these limitations, Ethereum has much more functionality than other cryptocurrencies and is gaining in popularity.
Dogecoin
The best cryptocurrency. It uses a logarithmic reward function, so the first few blocks yield many dogecoins, while later blocks yield fewer. This guarantees that lots of coins enter circulation very quickly, making it a viable currency immediately after launch. It also uses scrypt instead of sha256, and so doesn’t suffer from the same GPU and ASIC-mining problems plaguing bitcoin.
Dogecoin was started as a meme in 2013, but is collectively valued at over $340 million as of June 2017, which its user-base finds hilarious. However, because of the massive number of coins in circulation, a single dogecoin is only worth about $0.00095.
The Dogecoin community is particularly noteworthy for donating more than $30,000 to ensure the Jamaican bobsledding team could travel to the 2014 Winter Olympics.
Social networks should not be DAGs
Posted 6/23/17
This post continues the discussion of modeling social organizations using Neural Networks.
The Setup
Over the past week, I have been working with a neural network that represents a DAG of the following scenario:
-
There are ten agents (people, computers, etc) in an organization
-
There are five “environment” nodes, representing information in the world
-
Each agent can either listen to an environment node, or listen to messages from another node
-
There is a cost to all communication, as described in my previous post
-
Each agent is calculating the average of the five environment values
The neural network is attempting to minimize communications costs, while maximizing the accuracy of each agent’s information. The equation for loss looks like the following:
for each agent:
    difference += mean(environment) - mean(agent's estimate of each environment node)
    cost += listening_cost_for_agent + speaking_cost_for_agent
total_loss = (difference / num_agents) + cost
To start with, all agents will listen to each agent under them (A9 can listen to everyone, A8 to everyone except A9, …), and will listen to all environment nodes. The neural network will then remove edges until it reaches maximum efficiency. We’ll begin assuming messages between agents are just as expensive as listening to the environment.
Results
In an ideal world, the solution to the problem is as follows:
This has the lowest total cost because each agent only has to listen to one other node, except for A0, who listens to all the environment nodes and distributes the information. However, the neural network regularly produces solutions like the following:
In this model, A0, A1, and A2 all read from the environment nodes, and everyone else listens to A2. Why?
This is a problem known as a local minima. As the neural network slowly took optimization steps (“learning”), it realized it could reduce cost if A1 stopped listening to A0. Unfortunately, this means A1 must listen to all the environment nodes to get an accurate estimate. If it wanted to listen to A0 instead it would first have to add an edge to listen to A0, which would increase cost, and is therefore unlikely to be chosen. This gets the entire network “stuck”.
Problems with the Model
The main issue leading to the above local-minima is that we are optimizing for an unnatural situation. With a directed acyclic graph, A0 must always listen to all the environment nodes, since it is forbidden from listening to any other agents. Therefore, we should not be optimizing for lowest communications cost, but for the fastest path from each agent to A0.
The model is also inaccurate in that it minimizes only total cost, not per-agent cost. If we grow the environment, to say a million nodes, it becomes ridiculous to suggest a single agent should be listening to the whole environment. A more accurate representation of the world would minimize the cost for each agent, distributing work, and possibly coming up with something closer to the following:
This produces slightly higher total message costs, but each agent on the inner ring only needs to listen to two and send two messages, and those on the outer ring only need to listen to a single message.
Next Steps
Moving forward, we need a new model for network communication costs - preferably one not based on a DAG. From there we can develop other models, representing fragmented information (not every agent needs to know everything about the environment), redundancy problems, and so on.
Attribution
This post is based off of research I am working on at the Santa Fe Institute led by David Wolpert and Justin Grana. Future posts on this subject are related to the same research, even if they do not explicitly contain this attribution.
Optimizing Network Structure
Posted 6/14/17
We want to develop an “optimal” network. Here we mean “network” in the scientific sense: Any graph structure from a corporate hierarchy, to a military chain of command, to a computer network apply. What is “optimal” is user-defined - maybe we want to move information as quickly as possible, maybe we want something that works correctly event when many nodes go offline.
Given such a broad problem, the only reasonable solution looks like machine learning. Let’s dive in.
What does the network look like?
Let’s define a network as a DAG, or Directed Acyclic Graph. This is a simplification, as it assumes all communications are one-directional, but this lack of cycles will make the network much easier to reason about.
So the network is a series of nodes, with each lower-level node able to send messages to higher-level nodes (represented as edges).

What does communication look like?
Every message has two costs - one to send and one to receive. Let me justify that in two different scenarios, and we’ll say it generalizes from there.
Human Society:
If I want to communicate an idea I need to express myself clearly. Putting more time and thought in to how I phrase my idea, and providing background knowledge, can make it more likely that I am understood.
If you want to understand the idea I am telling you then you need to pay attention. You can pay close attention and try to follow every word I say, or you can listen/read half-heartedly and hope I summarize at the end.
Computer Network:
I am sending a message over a network with some noise. It could be a wireless network on a saturated frequency, a faulty switch, or just some very long wires with EM interference. I can counteract the noise by adding parity bits or some more complex error correction code. Doing so makes my message longer and requires more CPU time to encode.
Similarly, a receiver needs to decode my message, verify all the checksums, and correct errors. Therefore, transmitting a “better” message costs both bandwidth and CPU time on both ends of the connection.
How do we optimize?
This is already smelling like a machine learning “minimization” or “maximization” problem. All we need now is a continuous scoring function. Something like:
total_score = success_level - cost
From here, we could use a variety of tools like a Neural Network or Genetic Algorithm to maximize the total score by succeeding as much as possible with as little cost as possible.
The “success level” will be defined based on the constraints of the problem, and may be any number of arbitrary measurements:
- How many nodes receive information X propagating from a seed node?
- How many nodes can get three different pieces of information from different sources and average them?
- How many nodes can be “turned off” while still getting information to the remaining nodes?
- And many others…
Machine Learning Model
A DAG already looks pretty similar to a neural network, so let’s start by using that for our ML model. The model doesn’t quite fit, since neural networks have an “input” and “output” and are typically used for decision making and function approximation. However, the process of adjusting “weights” on each edge to improve the system over time sounds exactly like what we’re trying to do. So this won’t be a typical neural network, but it can use all the same code.
Dynamic Topology
All of the above sounds great for figuring out how much effort to put in to both sides of a communication channel. It even works for optimizing the cost of several edges in a network. But how can it design a new network? As it turns out, pretty easily.
Start with a transitive closure DAG, or a DAG with the maximum possible number of edges:

For every edge, if either one side puts no effort in to sending their message, or the other side puts no effort in to receiving a message, then any message that gets sent will be completely lost in noise, and never understood. Therefore, if the receiver cost isn’t high enough on an edge, we can say the edge effectively does not exist.
Coming Soon
Future posts will talk about implementing the system described in this post, applications, and pitfalls.
Attribution
This post is based off of research I am working on at the Santa Fe Institute led by David Wolpert and Justin Grana. Future posts on this subject are related to the same research, even if they do not explicitly contain this attribution.
Network Coding
Posted 6/6/17
I was recently introduced to the idea of Network Coding, a relatively obscure and rarely implemented technique for simplifying routing and increasing network throughput and security.
This post is an introduction to the theory, but there may be future posts on its application.
The Problem
We’ll start with the quintessential Network Coding problem - The Butterfly Network.
Assume we have data streams A and B, both of which must pass through the network to reach clients 1 and 2. The network topology looks something like the following:

We’ll say that this is a simple network, where each node can only transmit one bit at a time. Therefore, we have a bottleneck: The first switch can either transmit data stream A, or data stream B, but not both at once. This means with traditional routing we must choose to prioritize either client 1 or 2, delaying the other.
Network Coding, however, provides an alternate solution. The first switch combines the two data streams, and transmits A+B to both clients. The result looks as follows:

Now client 1 can reconstruct data stream B by subtracting A from A+B, and client 2 can similarly reconstruct A by subtracting B from A+B. As a result we have satisfied both clients using only one transmission, with no delays.
Layering Signals
The key to network coding, of course, is how to combine and separate data streams. In a computer science context, with bits and bytes, we can define the layering as xor, such that A+B means A^B. This is extremely convenient, as with the properties of xor we can reconstruct the original streams with B=A^(A^B) and A=B^(A^B).
In a more generic “signals” context, you can think of A+B as layering two waves on top of each other, then extracting either wave by subtracting the other.
Security Benefits
Network coding has a number of advantages besides solving the butterfly routing problem, but one I mentioned already was security. Layering data with network coding provides defense against some types of eavesdropping attacks, because given either A or A+B it is impossible to extract B. This makes it potentially advantageous to fragment your data and send it over multiple channels, making full message recovery difficult for an attacker.
Captcha
Posted 5/25/17
Recently I was working on a MUD, or Multi-user-dungeon with a friend. Like many multi-player games, MUDs are vulnerable to scripting and cheating. To prevent cheating many MUDs rate-limit commands from users, or have a concurrent turn-based system, where events occur at set intervals regardless of when commands were entered.
But what about preventing users from scripting account registration? On the web we often use CAPTCHAs to prevent automation, so what if we could do…
Captchas on the command-line
We want to reproduce this:

In a terminal like this:
Captcha:
 _
| |    |                                      o
| |  __|          __,  _  _         __,   __      _
|/  /  |  |   |  /  | / |/ |  /\/  /  |  /  \_|  |/
|__/\_/|_/ \_/|_/\_/|/  |  |_/ /\_/\_/|_/\__/ |_/|__/
                   /|
                   \|
Answer: ldugnxaoie
Correct!
Generating a captcha as ASCII art is pretty easy using figlet. The whole thing comes out to:
#!/usr/bin/env ruby

Fonts = ["small", "mini", "script", "standard", "slant", "banner"]
Letters = ('a'..'z').to_a.shuffle[0,rand(8..12)].join
Text = `figlet -f #{Fonts.sample(1)[0]} #{Letters}`

puts "Captcha:"
puts "#{Text}"
print "Answer: "
response = gets
unless( response.nil? )
        response.rstrip!
end
if( response == Letters )
        puts "Correct!"
        exit 0
else
        puts "Incorrect."
        exit 1
end
And there’s my terrible idea for the day.
SnailDoor, the Socketless Backdoor
Posted 3/7/17
Imagine a system where users can ssh in, but once logged in cannot create any sockets (or at least, all connections are blocked by a firewall). So you can run code on the system, but can’t create network services for anyone else without giving them your password.
However, there is an instance of Apache running, with home directory hosting enabled. It only supports static files, but surely we can tunnel through this somehow? Enter SnailDoor, which implements a network shell as a crude proof of concept for the technique.
Overview
SnailDoor creates 256 files in the web hosting folder, one for each potential byte. It then records the file access time, and polls all the files a few times a second to see if the access time has changed.
for bf in byteFiles:
    newtime = os.path.getatime(bf.path)
    if( newtime != bf.accesstime ):
        shellBuffer += [bf.byte]
If the access time has changed for a file, SnailDoor adds the corresponding byte to its buffer. It continues polling in a loop until it reads a newline, at which point it executes the buffer as a shell command, and saves the results to output.txt, also in the web hosting folder.
The client can now write a character at a time to the server by making a GET request to http://somewebsite/byte.txt, as follows:
for char in list(cmd):
    filename = str(ord(char)) + ".txt"
    urllib2.urlopen(url + "/" + filename).read()
Caveats
With a trivial implementation, SnailDoor is limited to one-byte-per second in the to-server direction, or 8-baud. This is because file access timestamps are stored in epoch time, which has an accuracy of one second. If multiple files are accessed in a second then each will have the same access time, making the byte order impossible to determine.
However, there are optimizations to stretch this limit. If we create a second set of 256 files we can represent even and odd bytes, increasing bandwidth to 2 bytes per second. Obviously this is an O(n) solution, and with 38400 files we can reach 1200 baud, which is fast enough for a decent interactive shell.
The largest limitation of SnailDoor is that it relies on the accuracy of access timestamps. These are an inherently inefficient part of the filesystem, since they require a write to disk every time a file is read. As a result, many sysadmins disable access time recording, so access time is only updated when a file is written to.
The Diffie-Hellman Key Exchange Made Simple
Posted 1/10/17
To send encrypted messages to one another we need one of two things:
-
Public/Private Keypairs
-
A Shared Secret
The Diffie-Hellman Key Exchange is a technique for generating a shared secret securely, even over an insecure channel where someone may be listening in. I have found many explanations of Diffie-Hellman to be needlessly complex, and so this post will attempt to describe the algorithm simply and succinctly.
The Necessary Math
Diffie-Hellman is based on two principles. Understanding both is essential to understanding why Diffie-Hellman works, and why it is secure.
-
Given a, n, and ax mod n, it is hard to determine what x is
-
axy == ayx
The first is true because assuming x is reasonably large it will take a long time to discover by brute force, and the modulus prevents any kind of sneaky shortcut like trying big and small numbers to close in on the correct value.
The second is true because axy == ax*y by the power rule, and ax*y == ay*x because multiplication is commutative.
The Exchange
Alice and Bob want to send secret messages back and forth, and must first generate a shared secret. The process is as follows:
-
Alice and Bob agree on a base g, and a modulus n, where n > g
-
Alice chooses a secret number x, and A = gx mod n
-
Bob chooses a secret number y, and B = gy mod n
-
Alice sends Bob A
-
Bob sends Alice B
-
Alice calculates s = Bx mod n
-
Bob calculates s = Ay mod n
Both sides now have a shared secret s, which is equal to gxy mod n, and is equal to gyx mod n.
From here, s can be used as the key for a number of symmetric ciphers like AES.
Why is it secure?
No one ever sends x or y across the network. Without at least one of these values, an eavesdropper can never learn what gxy mod n is.
This means two people can generate a shared secret even in the presence of a passive attacker, and still remain secure.
When is it not secure?
Diffie-Hellman key exchanges are vulnerable to active attackers. This means if someone blocks the connection between Alice and Bob, they can introduce their own secret and man-in-the-middle all messages between Alice and Bob.
Charlie generates their own secret number z, and C = gz mod n. They send C to Alice and Bob.
Alice and Charlie then generate s1 = gxz mod n, while Bob and Charlie generate s2 = gyz mod n.
Charlie can now intercept all the messages between Alice and Bob, decrypt them with s1, and re-encrypt them with s2.
Puddle
Posted 11/14/16
Puddle is a prototype anonymity network designed and implemented by a friend (Taylor Dahlin) and myself. It lacks any cryptography, but explores how to perform anonymous routing and decentralized information lookups. Below is an adaptation of our research paper describing the system.
Overview
Information online is shared in two distinct styles. The first is in terms of specific data: A single email, or a URL to an exact webpage. This form is convenient for storing information, but makes finding information tedious. The second style of information sharing, a search engine, makes use of non-specific information. A user requests data on a topic, and the search engine returns all relevant specific data.
Information in anonymity networks, or “darknets”, is almost exclusively shared using the specific file style. Search engines seem to be the antithesis of anonymity, as a traditional search engine maintains an index of all information on a network and where it is located, and is also in a perfect position to track what data users are interested in. Unfortunately this makes discovering information on networks like Tor and I2P frustrating and unapproachable for even technical users.
Puddle is an attempt at a distributed and anonymous search engine system. Similar to an engine like Google a client can send out a request for information on a particular subject, and the network will return relevant files. However, unlike public search engines Puddle has no central index of information, or any bottlenecks where requests can easily be traced to their origin.
Design
Puddle is implemented as an HTTP API. This provides a simple framework for requests and responses. GET requests represent requests for information, while PUT requests represent uploads of data related to the GET subject.
HTTP requests are rippled through connected nodes using a “time-to-live” to ensure that requests do not bounce indefinitely, and do not require a specific route.
Each information request is sent with two time to live values, formatted as follows:
GET /relay/:ttlOrig/:ttlCurrent/:topic
The “current” TTL acts like normal: It is decremented at each hop through the network, and the message is discarded if the TTL reaches zero.
The “original” TTL is used for responses, telling each relay how high a TTL it needs to set to guarantee its message will reach the source. Both time-to-lives are slightly randomized, so it is impossible to determine where a message originated unless an assailant controls all neighbors of the originating relay.
Responses to information requests are formatted as:
PUT /relay/:ttl/:topic/:filename
The response uses only a single time to live, responds to a specific topic, and specifies the appropriate filename. The content of the PUT request is the file data itself.
In both requests the topic and filename are base64 and then URL encoded, to ensure that malicious filenames or topics cannot be chosen to malform the URL.
Implementation
We implemented Puddle in Ruby for rapid prototyping in a loose-typed language. Our implementation is broken into five segments:
-
Request Processing - Receives HTTP requests for information or responses with information
-
File Processing - Manages files being shared, downloaded, or cached
-
Signalling - Sends new requests or forwards the requests from other relays
-
Client - Handles interaction with the user via a web interface
-
Peeting - Manages adding new peers, removing defunct ones, and integrating into the larger network
Request Processing
We use Sinatra (an HTTP server library) to register handlers for each type of request. These handlers then pass off work to the file or signalling modules as needed.
File Processing
The file processing module reads the files in a “data” folder and determines what topics they are related to. When the module receives a request it checks whether there is relevant data, and if there is sends those files to the Signalling module. It also manages a data cache of files that have passed through the relay recently. This ensures that information that is frequently requested on the network propagates and becomes faster to fetch in the future.
Signalling
This module sends HTTP requests to other relays. It acts as a thread pool so that requests can pile up and be sent incrementally. Otherwise this module is mostly a wrapper around different HTTP requests. We use the “patron” library to send HTTP requests for us, simplifying the networking requirements substantially.
Client
The client module is similar to the “request processing” module except that it maintains an internal website for human users to input requests, retrieve results, and view the current state of the node. This part of the website is restricted so it can only be accessed from localhost, providing a modicum of authentication.
Conclusions
Our implementation of Puddle is only a proof of concept, and has many shortcomings. However, it achieves its goal of creating a decentralized and anonymous search system. We hope that other scientists see our design and build off of it to create a more complete network.
Further Work
There are several areas our implementation does not yet touch on. First, we do not use cryptography. Encryption is not strictly necessary for anonymity in Puddle, as privacy is protected by randomized time-to-live values that conceal the origins of messages. However, encryption is necessary to protect against a Sybil attack, as we would need a method similar to Pisces’ cryptographically signed routing tables to detect malicious relays.
Puddle is also vulnerable to denial of service attacks. Since each message ripples from a relay to all of its peers there is a great deal of bandwidth used, and on tightly linked networks there is a high level of message duplication. One potential solution is to use random walks down a small number of neighboring relays, rather than broadcasting messages to everyone. This limits the bandwidth used, but also limits how many relays will be reached, potentially missing hosts with relevant content. Relays would need to re-transmit requests so long as the user is still interested to ensure that the likelihood of reaching a relevant relay is high.
Finally, our implementation uses a trivial definition of “relevant” content, and determines which files to up-load solely based on the filenames. A next step would be implementing some type of tagging system, or applying natural language processing to files to automatically determine what content is relevant to a request. Such a solution would also need to account for file name collisions, and how to handle extremely large files that could clog the network.
Traceroute is Black Magic
Posted 8/17/16
Traceroute is a utility for detecting the hops between your computer and a destination server. It is commonly used for diagnosing network problems, and in conjunction with ping makes up the majority of ICMP traffic.
It is also a piece of black magic that exploits the darkest turns of networking to succeed.
Traceroute Overview
At its core, traceroute is simple:
-
Send a packet to the destination with a time-to-live of 1
-
When the packet inevitably fails to deliver, the furthest computer it reached sends back a “time exceeded” packet
-
Now try again with a time-to-live of 2…
This continues until a packet finally does reach the destination, at which point the traceroute is finished. The time-to-live of the successful packet tells you how many hops away the destination server is, and the hosts the “time exceeded” packets come from gives you the address of each server between you and the host. The result is the familiar output:
% traceroute google.com
traceroute to google.com (216.58.194.174), 64 hops max, 52 byte packets
 1  10.0.0.1 (10.0.0.1)  1.274 ms  0.944 ms  0.897 ms
 2  96.120.89.65 (96.120.89.65)  19.004 ms  8.942 ms  8.451 ms
 3  be-20005-sur04.rohnertpr.ca.sfba.comcast.net (162.151.31.169)  9.279 ms  9.269 ms  8.939 ms
 4  hu-0-2-0-0-sur03.rohnertpr.ca.sfba.comcast.net (68.85.155.233)  9.546 ms  9.101 ms  9.935 ms
 5  be-206-rar01.rohnertpr.ca.sfba.comcast.net (68.85.57.101)  9.197 ms  9.214 ms  9.443 ms
 6  hu-0-18-0-0-ar01.santaclara.ca.sfba.comcast.net (68.85.154.57)  12.564 ms
    hu-0-18-0-4-ar01.santaclara.ca.sfba.comcast.net (68.85.154.105)  11.646 ms
    hu-0-18-0-1-ar01.santaclara.ca.sfba.comcast.net (68.85.154.61)  13.703 ms
 7  be-33651-cr01.sunnyvale.ca.ibone.comcast.net (68.86.90.93)  12.517 ms  12.109 ms  14.443 ms
 8  hu-0-14-0-0-pe02.529bryant.ca.ibone.comcast.net (68.86.89.234)  12.600 ms  12.057 ms
    hu-0-14-0-1-pe02.529bryant.ca.ibone.comcast.net (68.86.89.230)  12.915 ms
 9  66.208.228.70 (66.208.228.70)  12.188 ms  12.207 ms  12.031 ms
10  72.14.232.136 (72.14.232.136)  13.493 ms  13.934 ms  13.812 ms
11  64.233.175.249 (64.233.175.249)  12.241 ms  13.006 ms  12.694 ms
12  sfo07s13-in-f14.1e100.net (216.58.194.174)  12.841 ms  12.563 ms  12.410 ms
Well that doesn’t look so bad! It gets a little messier if there are multiple paths between you and the host, particularly if the paths are of different lengths. Most traceroute implementations deal with this by sending three different probes per TTL value, thus detecting all potential paths during the scan. You can see this under hops ‘6’ and ‘8’ in the above example.
The real dark side is in how to support multiple traceroutes at once.
How does the Internet work, anyway?
When you send a TCP or UDP packet it includes four key pieces of information:
-
Source IP (so the other side can write back)
-
Source Port (so you can distinguish between multiple network connections, usually randomly chosen)
-
Destination IP (so your router knows where to send the packet)
-
Destination Port (so the server knows what service the packet is for)
TCP also includes a sequence number, allowing packets to be reorganized if they arrive in the wrong order. UDP opts for “drop any packets we don’t get in order.”
However, ICMP is a little different. It includes the source and destination addresses, but has no concept of a “port number” for sending or receiving.
Traceroute can send probes in TCP, UDP, or ICMP format, but it always receives responses as ICMP “TIME EXCEEDED” messages.
Parallel Traceroute
So if ICMP responses don’t include port numbers, how can your computer distinguish between responses meant for different traceroutes?
The trick is in a minor detail of the ICMP specification. For Time Exceeded messages the packet includes a type (11 for time exceeded), code (0 or 1 depending on the reason the time was exceeded), a checksum, and the first 8 bytes of the original packet.
UDP is just small enough that the first 8 bytes of the UDP header include the source port. Thus if we choose our source port for our probe carefully we can use this same number as an ID received in the ICMP response. This requires creating our own raw packets (as root) so we can select a source port, and then parsing the bytes of the ICMP response ourselves to extract the ID.
On FreeBSD the traceroute program is setuid root for this purpose, and it uses its own process-ID to select an unused source port for its probes. To quote the FreeBSD implementation source code:
Don’t use this as a coding example. I was trying to find a routing problem and this code sort-of popped out after 48 hours without sleep. I was amazed it ever compiled, much less ran.
And yet it does run, and has run this way for more than 20 years.
Why do you know this? What’s this arcane knowledge good for?
I implemented traceroute in Python. It was part of a larger project to detect critical hub systems across the Internet, which may be deserving of its own article once I have more conclusive data. The point is I needed to run a lot of traceroutes simultaneously, and doing it myself with multithreading gave me better access to data than trying to parse the output from the traceroute program over and over.
Let’s talk about touch-tone telephones!
Posted 8/16/16
You remember the soft beeping of old phones when you punched in numbers? I wonder how those work! Sounds like a good premise for a project. Let’s write a script that takes a bunch of numbers and outputs the appropriate tones, and no cheating by saving off recordings of the beeps.
Signal Overview
Dual Tone Multiple Frequency signals are a way of transmitting computer-readable data over analog lines. It works by combining two different sine waves to create a single tone:
| 1209 Hz | 1336 Hz | 1477 Hz | 1633 Hz | |
|---|---|---|---|---|
| 697 Hz | 1 | 2 | 3 | A |
| 770 Hz | 4 | 5 | 6 | B |
| 852 Hz | 7 | 8 | 9 | C |
| 941 Hz | * | 0 | # | D |
Why does it work this way? Ruggedization. Analog audio equipment can have weird distortions and pitch shifts, and if we used a single sine wave for each digit then those distortions could lead to misinterpreting a signal. Very awkward if you dial a phone number and it connects to the wrong person. By creating a dual-tone signal each digit is extremely distinct from one another and are almost impossible to confuse.
What are those “ABCD” digits? My phone doesn’t have them!
Those are used within the telephone company for some internal controls. They’re interesting, and you can read more about them here, but they’re outside the scope of my project.
Trigonometry
If you’re like me and you forgot your trigonometry, don’t worry! Adding two waves is very simple. Sine waves output between -1 and 1. A higher frequency means the wave repeats itself more quickly, while a higher wavelength (and lower frequency) means the waves are more drawn out.
We can add two waves by layering them over each other on a graph, and adding their points together. If one wave is at -1, and the other is at 0.25, then the new wave has a point of -0.75. The effect looks like this:

The Code
At this point all we have left is implementation. I went at this in a clunky way:
-
Figure out how long our tone needs to be
-
Choose the two waves we need to make up a digit
-
Create an array of outputs, where each entry is the noise of the digit at a specific point
-
Convert the array of outputs to a wave file
The code is fairly simple, and all up on GitHub. The core is calculating the value of a wave at a certain point in its period:
Math::sin(position_in_period * TWO_PI) * max_amplitude
The amplitude (height of the wave) determines the volume of the tone.
After that, all that’s left is using the Ruby Wavefile Gem to encode the array of samples as noise and save it to disk, and then a little glue code to parse user input and trigger all the calculations.
One day this might have been an awesome tool for Phone Phreaking, but today most of the telephone network is digital, and there’s only so much you can do with a tone generator. So it goes.